2,181
Views
45
CrossRef citations to date
0
Altmetric
Original Research

PD-L1 (CD274) copy number gain, expression, and immune cell infiltration as candidate predictors for response to immune checkpoint inhibitors in soft-tissue sarcoma

, , , , ORCID Icon, ORCID Icon, ORCID Icon, , , , , , , , , , , , & show all
Article: e1279777 | Received 01 Aug 2016, Accepted 04 Jan 2017, Published online: 07 Mar 2017

Figures & data

Figure 1. PD-L1 CNG in STS. (A) Percentages of focal gains, 9p gains, and chromosome 9 gains in different STS subtypes in the TCGA cohort. (B) Percentages of PD-L1 CNG in the independent high-grade sarcoma cohort. (C) Overview of PD-L1 co-amplified genes on chromosome 9p. A core region including 27 genes (length, 5.6 Mb; inset) was co-amplified in more than 80% of STS with focal PD-L1 CNG (TCGA cohort).
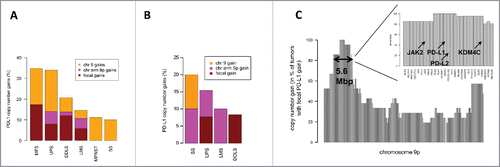
Figure 1. PD-L1 CNG in STS. (A) Percentages of focal gains, 9p gains, and chromosome 9 gains in different STS subtypes in the TCGA cohort. (B) Percentages of PD-L1 CNG in the independent high-grade sarcoma cohort. (C) Overview of PD-L1 co-amplified genes on chromosome 9p. A core region including 27 genes (length, 5.6 Mb; inset) was co-amplified in more than 80% of STS with focal PD-L1 CNG (TCGA cohort).

Figure 2. Immunohistochemical and FISH analysis of PD-L1 in 48 cases of the high-grade STS cohort. (A) Immunhistochemical staining and FISH for PD-L1. (1) PD-L1 staining of lung adenocarcinoma serving as a positive control. Note the membranous and cytoplasmic staining of tumor cells as well as membranous staining of inflammatory cells. (2) PD-L1 staining of tonsillar tissue illustrates membranous staining of lymphocytes and antigen presenting cells. PD-L1 CNG and protein expression in STS cases without (3) and with (5, and 7) CNG as detected by aCGH. Higher magnifications are presented aside (4, 6, and 8). A case of UPS (3, and 4) with balanced PD-L1 copy number on aCGH analysis showing absent PD-L1 protein expression. Representative pictures showing membranous staining of PD-L1 in a sample of DDLS (5, and 6) and UPS (7, and 8). Insets illustrates results of FISH analyses demonstrating PD-L1 copy number status (PD-L1/CEN9 dual-color FISH probe; green, PD-L1; red, CEN9; blue, DNA). Scale bars, 50 µm. (B) Pie chart showing the association of PD-L1 CNG, PD-L1 staining of tumors cells and PD-L1 staining of immune cells.
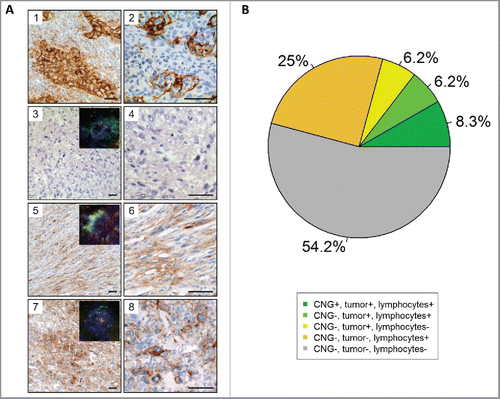
Figure 2. Immunohistochemical and FISH analysis of PD-L1 in 48 cases of the high-grade STS cohort. (A) Immunhistochemical staining and FISH for PD-L1. (1) PD-L1 staining of lung adenocarcinoma serving as a positive control. Note the membranous and cytoplasmic staining of tumor cells as well as membranous staining of inflammatory cells. (2) PD-L1 staining of tonsillar tissue illustrates membranous staining of lymphocytes and antigen presenting cells. PD-L1 CNG and protein expression in STS cases without (3) and with (5, and 7) CNG as detected by aCGH. Higher magnifications are presented aside (4, 6, and 8). A case of UPS (3, and 4) with balanced PD-L1 copy number on aCGH analysis showing absent PD-L1 protein expression. Representative pictures showing membranous staining of PD-L1 in a sample of DDLS (5, and 6) and UPS (7, and 8). Insets illustrates results of FISH analyses demonstrating PD-L1 copy number status (PD-L1/CEN9 dual-color FISH probe; green, PD-L1; red, CEN9; blue, DNA). Scale bars, 50 µm. (B) Pie chart showing the association of PD-L1 CNG, PD-L1 staining of tumors cells and PD-L1 staining of immune cells.

Figure 3. PD-L1 mRNA expression in the TCGA cohort (A) and in the independent cohort of high-grade STS (B). In the TCGA cohort, sarcomas with PD-L1 CNG showed higher PD-L1 expression than STS without PD-L1 CNG (fold change, 1.8; p = 0.02). PD-L1 expression was significantly higher in MFS compared with DDLS (fold change, 2.2; p = 0.036) and SS (fold change, 12.2; p = 0.00012). Furthermore, PD-L1 expression in LMS was significantly higher than in DDLS (fold change, 1.5; p = 0.039) and SS (fold change, 8.6; p = 0.00047). In the high-grade STS cohort, LMS and UPS cases showed highest PD-L1 expression levels, whereas PD-L1 expression was significantly lower (p < 0.05) in MLS compared with all other subtypes except MPNST.

Figure 3. PD-L1 mRNA expression in the TCGA cohort (A) and in the independent cohort of high-grade STS (B). In the TCGA cohort, sarcomas with PD-L1 CNG showed higher PD-L1 expression than STS without PD-L1 CNG (fold change, 1.8; p = 0.02). PD-L1 expression was significantly higher in MFS compared with DDLS (fold change, 2.2; p = 0.036) and SS (fold change, 12.2; p = 0.00012). Furthermore, PD-L1 expression in LMS was significantly higher than in DDLS (fold change, 1.5; p = 0.039) and SS (fold change, 8.6; p = 0.00047). In the high-grade STS cohort, LMS and UPS cases showed highest PD-L1 expression levels, whereas PD-L1 expression was significantly lower (p < 0.05) in MLS compared with all other subtypes except MPNST.

Figure 4. Analysis of mutational load in STS (TCGA cohort). (A) The median number of mutated genes was highest in MFS, followed by MPNST, UPS, LMS, DDLS, and SS. (B) Sarcomas with PD-L1 CNG and PD-L1 copy number losses showed a significantly higher mutational load compared with tumors without PD-L1 CNG.
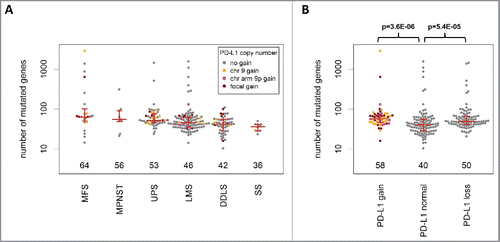
Figure 4. Analysis of mutational load in STS (TCGA cohort). (A) The median number of mutated genes was highest in MFS, followed by MPNST, UPS, LMS, DDLS, and SS. (B) Sarcomas with PD-L1 CNG and PD-L1 copy number losses showed a significantly higher mutational load compared with tumors without PD-L1 CNG.

Figure 5. Prognostic impact of PD-L1 CNG in STS (TCGA cohort). PD-L1 CNG were associated with shortened overall survival in (A) the entire TCGA cohort (162 patients, 56 events) and (B) in the LMS subcohort 63 patients, 22 events). Chromosome 9p gains were associated with shortened overall survival (C) in the entire TCGA cohort (162 patients, 56 events) and (D) in the LMS subcohort (63 patients, 22 events).
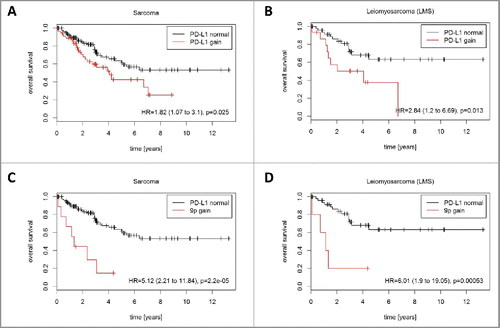
Figure 5. Prognostic impact of PD-L1 CNG in STS (TCGA cohort). PD-L1 CNG were associated with shortened overall survival in (A) the entire TCGA cohort (162 patients, 56 events) and (B) in the LMS subcohort 63 patients, 22 events). Chromosome 9p gains were associated with shortened overall survival (C) in the entire TCGA cohort (162 patients, 56 events) and (D) in the LMS subcohort (63 patients, 22 events).

Figure 6. Expression and prognostic impact of immune genes in STS (TCGA cohort). (A) Analysis of co-expression patterns and correlation of mRNA expression with overall survival in all STS. (B) Analysis of co-expression patterns and correlation of mRNA expression with overall survival in LMS. (C) Inferior prognosis of CD3Z low/PD-L1 CNG sarcomas. (D) Inferior prognosis of CD3Z low/PD-L1 CNG LMS.
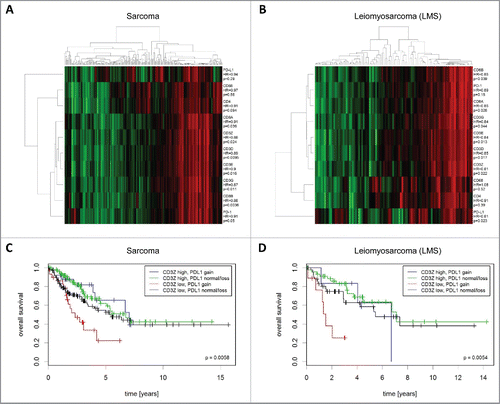
Figure 6. Expression and prognostic impact of immune genes in STS (TCGA cohort). (A) Analysis of co-expression patterns and correlation of mRNA expression with overall survival in all STS. (B) Analysis of co-expression patterns and correlation of mRNA expression with overall survival in LMS. (C) Inferior prognosis of CD3Z low/PD-L1 CNG sarcomas. (D) Inferior prognosis of CD3Z low/PD-L1 CNG LMS.
Supplemental material

KONI_A_1279777_s02.docx

Download MS Word (22.2 KB)

Reprints and Corporate Permissions

Please note: Selecting permissions does not provide access to the full text of the article, please see our help page How do I view content?

To request a reprint or corporate permissions for this article, please click on the relevant link below:

Academic Permissions

Please note: Selecting permissions does not provide access to the full text of the article, please see our help page How do I view content?

Obtain permissions instantly via Rightslink by clicking on the button below:

If you are unable to obtain permissions via Rightslink, please complete and submit this Permissions form. For more information, please visit our Permissions help page.