2,979
Views
16
CrossRef citations to date
0
Altmetric
Original research

Antigen receptor-redirected T cells derived from hematopoietic precursor cells lack expression of the endogenous TCR/CD3 receptor and exhibit specific antitumor capacities

, , , , , , , , , , , , & show all
Article: e1283460 | Received 06 Sep 2016, Accepted 12 Jan 2017, Published online: 01 Mar 2017

Figures & data

Figure 1. Differentiation of T-lineage committed CD34 cells after transduction with various antigen receptor constructs. Thymus-derived T-lineage CD34+ precursor cells were transduced to express a transgenic AR and subsequently cultured on OP9-DL1 feeder cells to induce terminal T cell maturation. (A) Flow cytometric analysis of transduced GFP+ and untransduced GFP cells 25 d after transduction of the cells to express the CAR:28ζ specific for CEA and subsequent culture on OP9-DL1 feeder cells. (B) T-lineage CD34+ precursor cells transduced to express the CAR:ζ or the CAR:28ζ. GFP+ cells are shown after 14 d and 25 d of culture (N = 5). (C) T-lineage CD34+ precursor cells transduced to express the CAR:ζ or the CAR:28ζ 25 d after the initiation of culture on OP9-DL1 feeder cells. The transgenic CAR was recorded using an anti-human IgG1 antibody. The percentages of CD4+ CD8β co-expressing cells and of mature CD27+CD1a cells were determined within a gate for cells with low CAR expression and a gate for cells with high CAR expression for CAR:ζ and CAR:28ζ transgenic cultures (N = 3).(D) T-lineage CD34+ precursor cells transduced to express the HLA-A2 restricted, gp100 specific wtTCR, TCR:ζ or the TCR:28ζ. Vβ14β+ cells are shown after 20 d of culture on OP9-DL1 feeder cells (N = 5), and (E) after an additional 7 d culture in the presence of the specific peptide (N = 2).
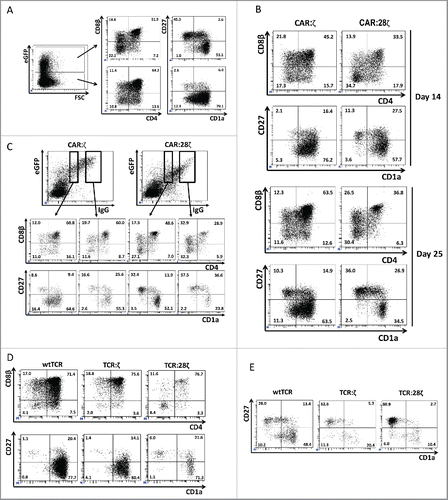
Figure 1. Differentiation of T-lineage committed CD34 cells after transduction with various antigen receptor constructs. Thymus-derived T-lineage CD34+ precursor cells were transduced to express a transgenic AR and subsequently cultured on OP9-DL1 feeder cells to induce terminal T cell maturation. (A) Flow cytometric analysis of transduced GFP+ and untransduced GFP− cells 25 d after transduction of the cells to express the CAR:28ζ specific for CEA and subsequent culture on OP9-DL1 feeder cells. (B) T-lineage CD34+ precursor cells transduced to express the CAR:ζ or the CAR:28ζ. GFP+ cells are shown after 14 d and 25 d of culture (N = 5). (C) T-lineage CD34+ precursor cells transduced to express the CAR:ζ or the CAR:28ζ 25 d after the initiation of culture on OP9-DL1 feeder cells. The transgenic CAR was recorded using an anti-human IgG1 antibody. The percentages of CD4+ CD8β co-expressing cells and of mature CD27+CD1a− cells were determined within a gate for cells with low CAR expression and a gate for cells with high CAR expression for CAR:ζ and CAR:28ζ transgenic cultures (N = 3).(D) T-lineage CD34+ precursor cells transduced to express the HLA-A2 restricted, gp100 specific wtTCR, TCR:ζ or the TCR:28ζ. Vβ14β+ cells are shown after 20 d of culture on OP9-DL1 feeder cells (N = 5), and (E) after an additional 7 d culture in the presence of the specific peptide (N = 2).

Figure 2. Expansion of T-lineage committed and fresh CD34+ HPC-derived transgenic AR+ T cells. Expansion and differentiation of the various AR-transgenic cell populations. (A) Progeny of one CD34+ cell obtained from thymus after transduction with the CAR:ζ or CAR:28ζ specific for CEA. Error bars represent SD, N = 3. (B) Progeny of one CD34+ cell obtained from thymus after transduction with the gp100-specific, HLA-A2 restricted wtTCR, the TCR:ζ or the TCR:28ζ construct with the same specificity. Error bars represent SD, N = 5. (C) Progeny of fresh CD34+ cord blood cells expanded and differentiated on OP9DL1 feeder cells for 13 d to CD5+CD7+ T-lineage restricted precursors and subsequent transduction to express the CAR:ζ or CAR:28ζ specific for CEA. Error bars represent SD, N = 3.
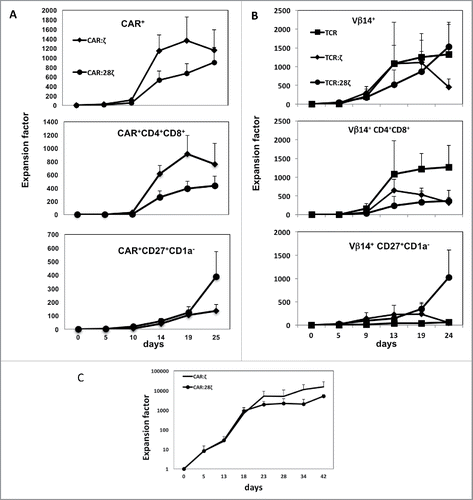
Figure 2. Expansion of T-lineage committed and fresh CD34+ HPC-derived transgenic AR+ T cells. Expansion and differentiation of the various AR-transgenic cell populations. (A) Progeny of one CD34+ cell obtained from thymus after transduction with the CAR:ζ or CAR:28ζ specific for CEA. Error bars represent SD, N = 3. (B) Progeny of one CD34+ cell obtained from thymus after transduction with the gp100-specific, HLA-A2 restricted wtTCR, the TCR:ζ or the TCR:28ζ construct with the same specificity. Error bars represent SD, N = 5. (C) Progeny of fresh CD34+ cord blood cells expanded and differentiated on OP9DL1 feeder cells for 13 d to CD5+CD7+ T-lineage restricted precursors and subsequent transduction to express the CAR:ζ or CAR:28ζ specific for CEA. Error bars represent SD, N = 3.

Figure 3. Phenotype and endogenous TCR expression of CD34+ HPC-derived transgenic AR+ T cells. Flow cytometric analysis of the AR-transgenic T cells. (A) CAR-transgenic GFP+ cells of cultures transduced to express either the CAR:ζ or the CAR:28ζ were analyzed on day 26 of OP9-DL1 culture for CD3 and TCRαβ expression. As a control, GFP cells are shown from the OP9-DL1 culture transduced to express the CAR:ζ (N = 5). (B) Dot plots show CD3 expression of cells from the OP9-DL1 cultures transgenic for the wtTCR, TCR:ζ and TCR:28ζ. Vβ14 staining is used to mark transgene expression, as no GFP is expressed by the transgenic cells (N = 5). (C) Surface and cytoplasmic staining for CD3 of in vitro generated mature T cells that were expanded for one cycle on feeder cells in the presence of cytokines. (D) Expression of various membrane markers by the CD27+CD1a mature T cells at the end of OP9-DL1 culture (46 d) (N = 2). (E) Day 0: fresh cord blood after MACS CD34 enrichment sorted using the sorting window shown. Day 13: cord blood cells cultured on OP9-DL1 were sorted for CD5 CD7 double positive cells, using the indicated sorting window. The cells were then transduced to express CAR:28ζ and further differentiated on OP9-DL1 feeder layer. Day 21: analysis of the transgenic GFP+ cultured cells for DP cells and CD27+CD1a mature cells. (F) Flow cytometric analysis of GFP+ CAR:28ζ-transgenic cultures, gated on GFP+ CD27+ CD1a mature AR+ cells (N = 2).

Figure 3. Phenotype and endogenous TCR expression of CD34+ HPC-derived transgenic AR+ T cells. Flow cytometric analysis of the AR-transgenic T cells. (A) CAR-transgenic GFP+ cells of cultures transduced to express either the CAR:ζ or the CAR:28ζ were analyzed on day 26 of OP9-DL1 culture for CD3 and TCRαβ expression. As a control, GFP− cells are shown from the OP9-DL1 culture transduced to express the CAR:ζ (N = 5). (B) Dot plots show CD3 expression of cells from the OP9-DL1 cultures transgenic for the wtTCR, TCR:ζ and TCR:28ζ. Vβ14 staining is used to mark transgene expression, as no GFP is expressed by the transgenic cells (N = 5). (C) Surface and cytoplasmic staining for CD3 of in vitro generated mature T cells that were expanded for one cycle on feeder cells in the presence of cytokines. (D) Expression of various membrane markers by the CD27+CD1a− mature T cells at the end of OP9-DL1 culture (46 d) (N = 2). (E) Day 0: fresh cord blood after MACS CD34 enrichment sorted using the sorting window shown. Day 13: cord blood cells cultured on OP9-DL1 were sorted for CD5 CD7 double positive cells, using the indicated sorting window. The cells were then transduced to express CAR:28ζ and further differentiated on OP9-DL1 feeder layer. Day 21: analysis of the transgenic GFP+ cultured cells for DP cells and CD27+CD1a− mature cells. (F) Flow cytometric analysis of GFP+ CAR:28ζ-transgenic cultures, gated on GFP+ CD27+ CD1a− mature AR+ cells (N = 2).
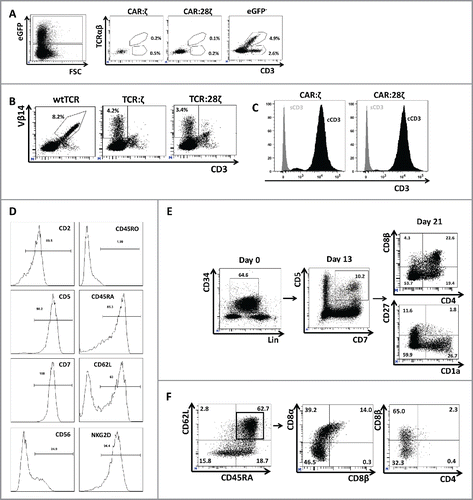
Figure 4. TCRα and TCRβ rearrangements in CD34+ HPC derived transgenic AR+ T cells. (A) Expression of the various components of the CD3/TCRαβ complex at the mRNA level. RT-PCR was performed on the JY B cell line as negative control, on a CAR:28ζ transgenic PBMC-derived T cell line (PBMC) as a positive control and on CAR transgenic HPC-derived cell lines of OP9 cultures transduced to express either the CAR:ζ (CAR:ζ) or the CAR:28ζ (CAR:28ζ). (B) TCR:ζ and TCR:28ζ transgenic CD3-negative HPC-derived T-cell lines were transduced to express the TCRα chain of a CMV-specific TCR and GFP as marker, the TCRβ chain with truncated NGFR as marker or with both TCR chains. Three days later, cells were gated for GFP+, NGFR+ or double positive cells and the CD3/TCRαβ expression was measured. Note that the TCRαβ antibody does not bind CD3-negative TCR:ζ nor TCR:28ζ complex although it binds to wtTCR/CD3 complexes. Percentage CD3/TCR positive cells is indicated in the upper right quadrant. (C) Histograms of read counts per CDR3 nucleotide length. CDR3α and CDR3β histograms are shown for wtTCR, TCR:ζ, TCR:28ζ, CAR:ζ and CAR:28ζ transgenic HPC-derived cell lines and as a control CAR:28ζ transgenic PBMC-derived T-cell line. All samples were spiked with Jurkat T cell line mRNA and CDR3α and CDR3β sequences of each transgenic cell line were determined by next-gen sequencing. Asterisk denotes the CDR3 length of the transgenic reads: CDR3α of 48 nucleotides encoding CAASTSGGTSYGKLTF and CDR3β of 39 nucleotides encoding CASSLGSSYEQYF. Arrow points at the CDR3 length of spiked Jurkat CDR reads: CDR3α of 51 nucleotides encoding CAVSDLEPNSSASKIIF and CDR3β of 48 nucleotides encoding CASSFSTCSANYGYTF).
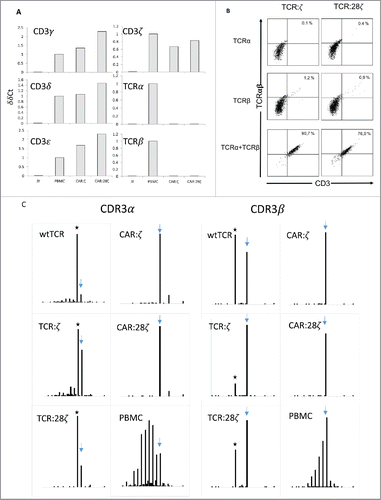
Figure 4. TCRα and TCRβ rearrangements in CD34+ HPC derived transgenic AR+ T cells. (A) Expression of the various components of the CD3/TCRαβ complex at the mRNA level. RT-PCR was performed on the JY B cell line as negative control, on a CAR:28ζ transgenic PBMC-derived T cell line (PBMC) as a positive control and on CAR transgenic HPC-derived cell lines of OP9 cultures transduced to express either the CAR:ζ (CAR:ζ) or the CAR:28ζ (CAR:28ζ). (B) TCR:ζ and TCR:28ζ transgenic CD3-negative HPC-derived T-cell lines were transduced to express the TCRα chain of a CMV-specific TCR and GFP as marker, the TCRβ chain with truncated NGFR as marker or with both TCR chains. Three days later, cells were gated for GFP+, NGFR+ or double positive cells and the CD3/TCRαβ expression was measured. Note that the TCRαβ antibody does not bind CD3-negative TCR:ζ nor TCR:28ζ complex although it binds to wtTCR/CD3 complexes. Percentage CD3/TCR positive cells is indicated in the upper right quadrant. (C) Histograms of read counts per CDR3 nucleotide length. CDR3α and CDR3β histograms are shown for wtTCR, TCR:ζ, TCR:28ζ, CAR:ζ and CAR:28ζ transgenic HPC-derived cell lines and as a control CAR:28ζ transgenic PBMC-derived T-cell line. All samples were spiked with Jurkat T cell line mRNA and CDR3α and CDR3β sequences of each transgenic cell line were determined by next-gen sequencing. Asterisk denotes the CDR3 length of the transgenic reads: CDR3α of 48 nucleotides encoding CAASTSGGTSYGKLTF and CDR3β of 39 nucleotides encoding CASSLGSSYEQYF. Arrow points at the CDR3 length of spiked Jurkat CDR reads: CDR3α of 51 nucleotides encoding CAVSDLEPNSSASKIIF and CDR3β of 48 nucleotides encoding CASSFSTCSANYGYTF).

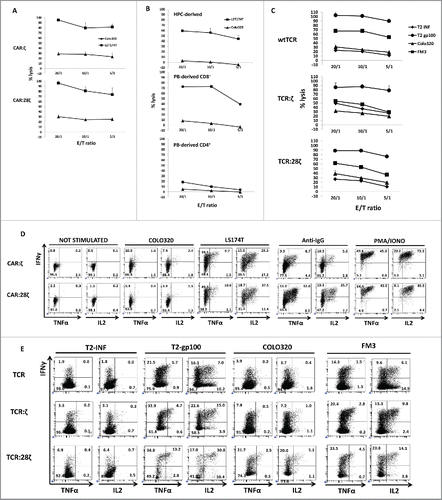
Figure 5. Antitumor activity of CD34+ HPC-derived transgenic AR+ T cells. Functional analysis of the in vitro generated AR+ cells after one round of expansion on feeder cells. (A) Killing activity at different E:T ratios against the CEA COLO320 and the CEA+ LST174T tumor cell line. HPC-derived cells were sorted for GFP+CD3 cells before expansion on feeder cells. Error bars represent SD of duplicate determinations (N = 3). (B) Killing activity of CAR:28ζ transgenic peripheral blood CD4+ and CD8+ (PB-derived) and in vitro generated, CD34+ HPC-derived CAR:28ζ transgenic cells. Error bars represent SD of duplicate determinations (N = 2). (C) Killing activity of wtTCR, TCR:ζ and TCR:28ζ transgenic in vitro generated cells toward gp-100+ FM3 and gp100 COLO320 tumor cell lines. TCR:ζ and TCR:28ζ transgenic cultures were sorted for Vβ14+CD3, wtTCR transgenic cultures were sorted for Vβ14+CD3+ cells. Error bars represent SD of duplicate determinations (N = 5). (D) Cytokine production by CAR:ζ and CAR:28ζ transgenic T-cell lines, either unstimulated or stimulated by PMA and ionomycin, plate-bound anti-IgG1, CEA COLO320 or CEA+ LST174T cells. All dot plots were gated on GFP+ cells (N >3 for all conditions). (E) Cytokine production by wtTCR, TCR:ζ and TCR:28ζ transgenic T-cell lines, sorted for Vβ14+ cells, after addition of T2 cells pre-incubated with an influenza peptide (T2-INF) or a gp100 peptide (T2-gp100), gp100 COLO320 or gp100+ FM3 tumor cell lines (N >3 for all conditions).

Figure 5. Antitumor activity of CD34+ HPC-derived transgenic AR+ T cells. Functional analysis of the in vitro generated AR+ cells after one round of expansion on feeder cells. (A) Killing activity at different E:T ratios against the CEA− COLO320 and the CEA+ LST174T tumor cell line. HPC-derived cells were sorted for GFP+CD3− cells before expansion on feeder cells. Error bars represent SD of duplicate determinations (N = 3). (B) Killing activity of CAR:28ζ transgenic peripheral blood CD4+ and CD8+ (PB-derived) and in vitro generated, CD34+ HPC-derived CAR:28ζ transgenic cells. Error bars represent SD of duplicate determinations (N = 2). (C) Killing activity of wtTCR, TCR:ζ and TCR:28ζ transgenic in vitro generated cells toward gp-100+ FM3 and gp100− COLO320 tumor cell lines. TCR:ζ and TCR:28ζ transgenic cultures were sorted for Vβ14+CD3−, wtTCR transgenic cultures were sorted for Vβ14+CD3+ cells. Error bars represent SD of duplicate determinations (N = 5). (D) Cytokine production by CAR:ζ and CAR:28ζ transgenic T-cell lines, either unstimulated or stimulated by PMA and ionomycin, plate-bound anti-IgG1, CEA− COLO320 or CEA+ LST174T cells. All dot plots were gated on GFP+ cells (N >3 for all conditions). (E) Cytokine production by wtTCR, TCR:ζ and TCR:28ζ transgenic T-cell lines, sorted for Vβ14+ cells, after addition of T2 cells pre-incubated with an influenza peptide (T2-INF) or a gp100 peptide (T2-gp100), gp100− COLO320 or gp100+ FM3 tumor cell lines (N >3 for all conditions).
Supplemental material

Supplementary_materials.zip

Download Zip (209.4 KB)