Figures & data
Figure 1. Distribution of common molecular alterations in PD-L1/2 overexpressed tumors (part A). Molecular alterations were ordered by descending frequency in the subset studied (n = 469 tumors), except for MSI-High as too many tumors were not evaluated for this marker. Each column represents a tumor. Dark green: tumor exempt of alteration. Light green: tumor not presenting the mutation. Gray: alteration not evaluated in the tumor. Purple: total number of mutations and kataegis-related mutations observed in each tumor, represented in percentile (minimum: light purple, maximum: dark purple). Frequency of alterations in comparison to non PD-1 ligand overexpressed tumors (part B). The table presents frequencies of alterations in both PD-1 ligand overexpressed and non-overexpressed tumors, p values of the univariate analysis and p values obtained in the final model of prediction for PD-1 ligand overexpression. Median alterations counts were 66.5 total mutations and 0 kataegis-related mutations per tumor. PD-L1 3′-UTR data were extracted from Ref. Citation11. This factor is displayed for descriptive purpose only and was not included in the analysis. Abbreviations. APOBEC = apolipoprotein B editing complex; MMR = mismatch repair; MSI = microsatellite instability; MSI-high = microsatellite instability high; ns = non-significant; 3′-UTR = 3′ untranslated region.

Table 1. Multivariate analysis of associationFootnotea between all factors and PD-1 ligand mRNA overexpression, using single factors (model A) or relevant combined factors (model B).
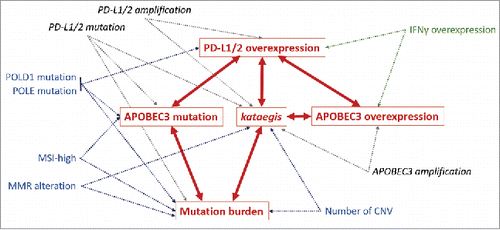
Figure 2. Graphical model of conditional dependences between PD-1 ligand overexpression, APOBEC3 mutation, APOBEC3 overexpression, kataegis and mutational burden predictors. Arrows represent dependent relationships between factors. Each dependent variable (in red) can be modeled by the association of independent factors pointing in its direction (multivariate models using combined factors, p ≤ 0.05). Confirmed bilateral relationships between major factors are represented in red. Common microsatellite and genomic instability factors are represented in blue. Additional genomic alterations are represented in dark gray and marker of lymphocyte activation (IFNγ overexpression) is represented in green. Associations with others APOBEC members and lymphocyte markers are not shown in this diagram. Abbreviations. APOBEC = apolipoprotein B editing complex; CNV = copy number variations; MMR = mismatch repair; MSI = microsatellite instability; MSI-high = microsatellite instability high.

Table 2. Multivariate analysis of associationFootnotea between all factors and tumor mutational burden (model A) or kataegis-signature (model B).
Table 3. Multivariate analysis of associationFootnotea between all factors and APOBEC3 members (APOBEC3A/B/C/D/F/G/H) mRNA overexpression (model A) or mutation (model B).
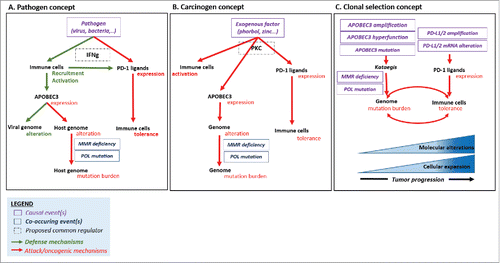
Figure 3. Causal hypothesis of mutation burden and immune tolerance co-occurrence in human tumors. Pathogen concept (Part A). Both PD-1 ligand and APOBEC enzymes are induced after viral infection, via interferon gamma (IFNγ) secretion. The defensive anti-viral function of APOBEC3 results in off-target alterations within the host genome, which can be repaired by DNA repair processes, unless alteration of these functions. Carcinogen concept (Part B). Both PD-1 ligand and APOBEC enzymes are regulated by the same factors, like exogenous activators. PKC has been linked to APOBEC3 and PD-L1 overexpression in distinct studies.Citation35 PKC can be activated by exogenous substances such as phorbol, which acts as a co-carcinogen and T-lymphocyte activator.Citation34 Clonal selection concept (Part C). Co-occurrence of kataegis-mutation process and expression of immune checkpoints such as PD-L1/2 leads to the accumulation of mutations and the tumor progression. In the presence of high level of mutation burden, only tumors that overexpress PD-L1 (and hence evade the immune system) survive. Other mechanisms of immune escape, not studied herein, could also be surgical. Abbreviations. APOBEC = apolipoprotein B editing complex; MMR = mismatch repair.

