2,389
Views
59
CrossRef citations to date
0
Altmetric
Original Research

Oncolytic measles virus encoding interleukin-12 mediates potent antitumor effects through T cell activation

, , , , , , , & show all
Article: e1285992 | Received 28 Nov 2016, Accepted 18 Jan 2017, Published online: 07 Apr 2017

Figures & data

Figure 1. Cloning and characterization of recombinant measles virus vectors. (A) Schematic of recombinant measles Schwarz/Moraten vaccine strain (MeVac) genomes. T1—murine granulocyte macrophage colony-stimulating factor (mGM-CSF), murine IP-10 (mIP-10) or enhanced green fluorescent protein (eGFP); T2—murine IL-12 fusion protein (FmIL-12); T3—antibody against murine CTLA-4 or PD-L1 or a soluble form of murine CD80 (mCD80-Fc) or antibody constant region IgG1-Fc; Hbl-αCEA—MeVac H protein targeted to CEA; N, P, M, F, L—measles structural proteins; ld—measles leader; tr—measles trailer. (B) Targeted infection. Parental Vero and Vero-αHis expressing a single chain antibody against 6 histidine tag (His6) as well as parental MC38 and MC38cea cells expressing CEA were infected with MeVac encoding eGFP with H retargeted to CEA and including a C-terminal His6 tag (multiplicity of infection (MOI) = 1). Fluorescence microscopy pictures were taken 72 h post infection. Scale bars 100 µm. (C) Expression kinetics of MeVac-encoded FmIL-12. MC38cea cells were transduced with MeVac encoding FmIL-12 and eGFP as a control vector at MOI = 3. Supernatants were collected at the depicted time points and transgene expression was analyzed by ELISA. To control for unspecific binding values of MeVac eGFP supernatants were subtracted from the specific measurements. (D) Induction of IFN-γ production by MeVac-encoded FmIL-12. Murine splenocytes were stimulated with recombinant murine IL-2 and cultivated in the presence of medium from Vero-αHis cells infected with MeVac FmIL-12 or MeVac eGFP. After 48 h supernatants were collected and IFN-γ concentrations were measured by ELISA. Mean IFN-γ concentrations with standard errors of the mean of triplicate splenocyte cultures are shown for each FmIL-12 concentration. IFN-γ concentrations in the eGFP controls were close to background (data not shown). Representative data from one of two independent experiments are shown.
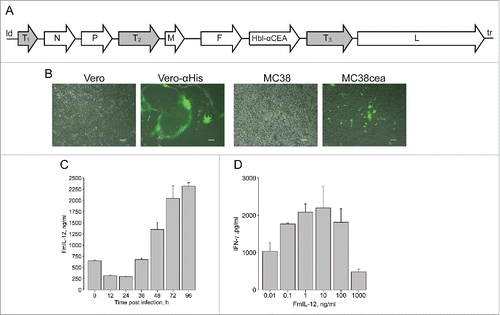
Figure 1. Cloning and characterization of recombinant measles virus vectors. (A) Schematic of recombinant measles Schwarz/Moraten vaccine strain (MeVac) genomes. T1—murine granulocyte macrophage colony-stimulating factor (mGM-CSF), murine IP-10 (mIP-10) or enhanced green fluorescent protein (eGFP); T2—murine IL-12 fusion protein (FmIL-12); T3—antibody against murine CTLA-4 or PD-L1 or a soluble form of murine CD80 (mCD80-Fc) or antibody constant region IgG1-Fc; Hbl-αCEA—MeVac H protein targeted to CEA; N, P, M, F, L—measles structural proteins; ld—measles leader; tr—measles trailer. (B) Targeted infection. Parental Vero and Vero-αHis expressing a single chain antibody against 6 histidine tag (His6) as well as parental MC38 and MC38cea cells expressing CEA were infected with MeVac encoding eGFP with H retargeted to CEA and including a C-terminal His6 tag (multiplicity of infection (MOI) = 1). Fluorescence microscopy pictures were taken 72 h post infection. Scale bars 100 µm. (C) Expression kinetics of MeVac-encoded FmIL-12. MC38cea cells were transduced with MeVac encoding FmIL-12 and eGFP as a control vector at MOI = 3. Supernatants were collected at the depicted time points and transgene expression was analyzed by ELISA. To control for unspecific binding values of MeVac eGFP supernatants were subtracted from the specific measurements. (D) Induction of IFN-γ production by MeVac-encoded FmIL-12. Murine splenocytes were stimulated with recombinant murine IL-2 and cultivated in the presence of medium from Vero-αHis cells infected with MeVac FmIL-12 or MeVac eGFP. After 48 h supernatants were collected and IFN-γ concentrations were measured by ELISA. Mean IFN-γ concentrations with standard errors of the mean of triplicate splenocyte cultures are shown for each FmIL-12 concentration. IFN-γ concentrations in the eGFP controls were close to background (data not shown). Representative data from one of two independent experiments are shown.

Figure 2. Therapeutic efficacy of MeVac FmIL-12 and MeVac anti-PD-L1. (A and B) MC38cea cells were implanted subcutaneously (s.c.) into the right flank of C57BL/6J mice (10 animals per group). When tumors reached an average volume of 40 mm3 animals received intratumoral injections with 1 × 10⁶ cell infectious units of MeVac encoding the respective transgenes in 100 µL or the respective amount of OptiMEM (mock) on four consecutive days. (A) Tumor volume distribution on day 16 post implantation. Dots representing individual mice and median values are shown. (B) Kaplan–Meier survival analysis. Complete tumor remission rates are shown for each group. (C–E) Systemic antitumor immunity in long-term survivors. Animals experiencing complete tumor remissions after MeVac treatment were rechallenged with s.c. MC38cea implantation 6 mo after initial tumor cell implantation. (C) Mice were monitored for tumor engraftment. Tumor rejection rates are shown. Splenocytes were collected from the rechallenged animals, stimulated with recombinant murine IL-2 and cocultivated with MC38cea cells (D) or with MC38 or B16 cells or DLD-1 cell lysate for one mouse from each group (E) at a ratio of 10:1. Supernatants were collected after 48 h and IFN-γ concentrations were measured by ELISA. Dots representing individual mice as well as medians are shown in d. Mean values with standard errors of the mean of two replicate measurements per sample are shown in e.
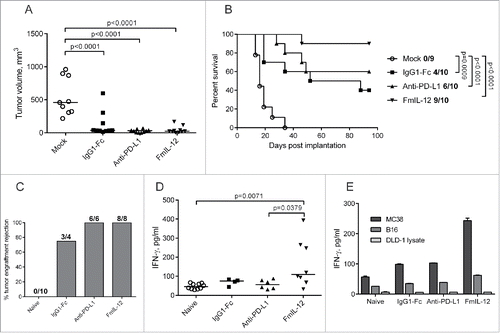
Figure 2. Therapeutic efficacy of MeVac FmIL-12 and MeVac anti-PD-L1. (A and B) MC38cea cells were implanted subcutaneously (s.c.) into the right flank of C57BL/6J mice (10 animals per group). When tumors reached an average volume of 40 mm3 animals received intratumoral injections with 1 × 10⁶ cell infectious units of MeVac encoding the respective transgenes in 100 µL or the respective amount of OptiMEM (mock) on four consecutive days. (A) Tumor volume distribution on day 16 post implantation. Dots representing individual mice and median values are shown. (B) Kaplan–Meier survival analysis. Complete tumor remission rates are shown for each group. (C–E) Systemic antitumor immunity in long-term survivors. Animals experiencing complete tumor remissions after MeVac treatment were rechallenged with s.c. MC38cea implantation 6 mo after initial tumor cell implantation. (C) Mice were monitored for tumor engraftment. Tumor rejection rates are shown. Splenocytes were collected from the rechallenged animals, stimulated with recombinant murine IL-2 and cocultivated with MC38cea cells (D) or with MC38 or B16 cells or DLD-1 cell lysate for one mouse from each group (E) at a ratio of 10:1. Supernatants were collected after 48 h and IFN-γ concentrations were measured by ELISA. Dots representing individual mice as well as medians are shown in d. Mean values with standard errors of the mean of two replicate measurements per sample are shown in e.

Figure 3. Intratumoral cytokine profiles after MeVac therapy. MC38cea tumor cells were implanted subcutaneously in C57BL/6J mice. When tumors reached an average volume of 120 mm3 animals received treatment with intratumoral injections of 1 × 10⁶ cell infectious units of MeVac encoding FmIL-12 or IgG1-Fc in 100 µL or with the respective amount of OptiMEM (mock) on four consecutive days. Cytokine bead arrays were performed using protein extracts from tumors explanted one day after the last treatment. Dots representing tumor samples from individual mice and median values are shown. Representative results from one of two independent experiments are shown.
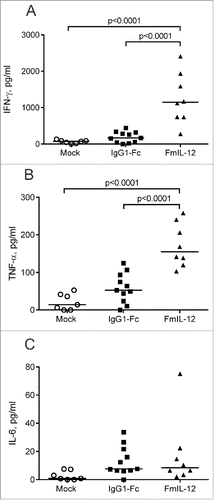
Figure 3. Intratumoral cytokine profiles after MeVac therapy. MC38cea tumor cells were implanted subcutaneously in C57BL/6J mice. When tumors reached an average volume of 120 mm3 animals received treatment with intratumoral injections of 1 × 10⁶ cell infectious units of MeVac encoding FmIL-12 or IgG1-Fc in 100 µL or with the respective amount of OptiMEM (mock) on four consecutive days. Cytokine bead arrays were performed using protein extracts from tumors explanted one day after the last treatment. Dots representing tumor samples from individual mice and median values are shown. Representative results from one of two independent experiments are shown.

Figure 4. Tumor-infiltrating lymphocytes after MeVac therapy. MC38cea tumor cells were implanted subcutaneously in C57BL/6J mice and established tumors were treated with intratumoral injections of MeVac encoding FmIL-12, IgG1-Fc or carrier fluid (mock) on four consecutive days (the same experiment is described in ). Single cell suspensions from the tumors were prepared and flow cytometry analysis was performed one day after the last treatment. Percentages of natural killer (NK) cells among all leukocytes (A), activated NK cells (B), T cells among all leukocytes (C) and activated cytotoxic T cells (D) are shown. Dots representing tumor samples from individual mice and median values are shown. Representative results from one of two independent experiments are shown.

Figure 4. Tumor-infiltrating lymphocytes after MeVac therapy. MC38cea tumor cells were implanted subcutaneously in C57BL/6J mice and established tumors were treated with intratumoral injections of MeVac encoding FmIL-12, IgG1-Fc or carrier fluid (mock) on four consecutive days (the same experiment is described in Fig. 3). Single cell suspensions from the tumors were prepared and flow cytometry analysis was performed one day after the last treatment. Percentages of natural killer (NK) cells among all leukocytes (A), activated NK cells (B), T cells among all leukocytes (C) and activated cytotoxic T cells (D) are shown. Dots representing tumor samples from individual mice and median values are shown. Representative results from one of two independent experiments are shown.

Figure 5. Impact of CD8+ T cell depletion on the therapeutic efficacy of MeVac FmIL-12. C57BL/6J mice were depleted of CD8+ T cells (Minus CD8+) by intraperitoneal antibody injections or left undepleted (mock, undepleted). MC38cea tumor cells were implanted subcutaneously and established tumors were treated with intratumoral (i.t.) injections of 1 × 10⁶ cell infectious units of MeVac encoding FmIL-12 (Minus CD8+, undepleted) in 100 µL on four consecutive days. Mock treated animals received i.t. OptiMEM injections. Kaplan–Meier survival analysis is shown.
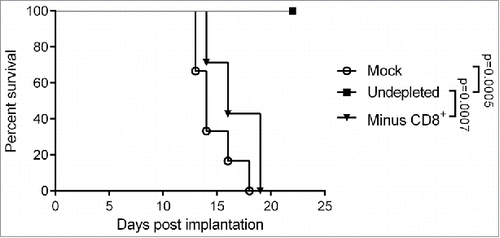
Figure 5. Impact of CD8+ T cell depletion on the therapeutic efficacy of MeVac FmIL-12. C57BL/6J mice were depleted of CD8+ T cells (Minus CD8+) by intraperitoneal antibody injections or left undepleted (mock, undepleted). MC38cea tumor cells were implanted subcutaneously and established tumors were treated with intratumoral (i.t.) injections of 1 × 10⁶ cell infectious units of MeVac encoding FmIL-12 (Minus CD8+, undepleted) in 100 µL on four consecutive days. Mock treated animals received i.t. OptiMEM injections. Kaplan–Meier survival analysis is shown.
Supplemental material

KONI_A_1285992_Supplementary_Figs.1-7.pdf

Download PDF (690.6 KB)

Reprints and Corporate Permissions

Please note: Selecting permissions does not provide access to the full text of the article, please see our help page How do I view content?

To request a reprint or corporate permissions for this article, please click on the relevant link below:

Academic Permissions

Please note: Selecting permissions does not provide access to the full text of the article, please see our help page How do I view content?

Obtain permissions instantly via Rightslink by clicking on the button below:

If you are unable to obtain permissions via Rightslink, please complete and submit this Permissions form. For more information, please visit our Permissions help page.