Figures & data
Figure 1. Agonistic anti-CD137 mAb exhibits antitumor activity and induces severe liver injury. Three groups of C57BL/six mice (n = 5 per group) were subcutaneously injected with 5 × 10⁵ MC38 tumor cells at day 0, and then treated with 100 µg 2A, RatIg or PBS for four times on days 8, 11, 14 and 18. (A) The tumor volumes in the three groups were monitored over time. Representative data from three independent experiments are shown. ##p < 0.01. (B) Tumor and liver sections were stained for CD8+ on day 21 after tumor inoculation. (C) Serum ALT levels in RatIg, 2A, and PBS-treated mice are shown. ##p < 0.01. (D) The liver sections were further stained for Gr-1 and F4/80 and (E) the numbers of Gr-1+ cells and F4/80+ cells in the livers per HPF (×200) are shown. ##p < 0.01. (F) Consecutive liver sections were stained with H&E and Sirius Red. Scale bar, 50 μm. (G) One group of C57BL/6 mice without tumors was also treated with 2A four times as a control. Serum ALT levels in 2A-treated mice with or without tumors are shown. ns, not significant.
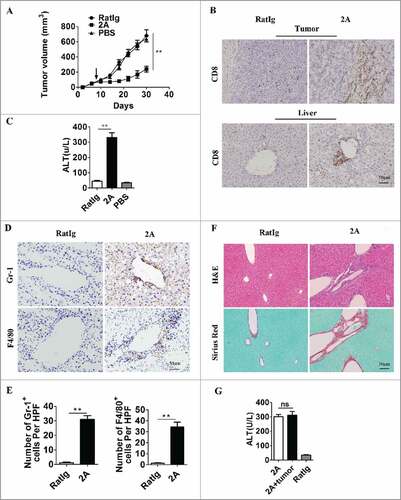
Figure 2. Anti-CD137 mAb treatment induce the infiltration of a large number of S100A4+ macrophages. (A) Schematic representation of the 2A-induced chronic liver injury model. 6-week-old C57BL/6 mice were treated with 100 µg 2A or RatIg weekly for 5 weeks. Liver tissue was harvested at the indicated time points for further observation. (B) Histological characterization of liver fibrosis and S100A4+ cell accumulation. Consecutive sections were stained with H&E, Sirius Red, or the anti-S100A4 antibody. Scale bar, 50 μm. (C) Quantification of Sirius Red areas in the liver sections. #p < 0.05. (D) To detect the number of S100A4+ cells that infiltrated the liver, S100A4+/+.GFP transgenic mice were treated with 2A as described above. Total numbers of GFP+ cells in the liver (calculated by multiplying the absolute number of liver non-parenchymal cells by the percentage of GFP+ cells) of the untreated (control) or 2A-treated mice at each time point were monitored. Statistical analysis was performed to compare the control group and the 2A-treated groups at different time points (n = 3 per group) after 2A injections. #p < 0.05. (E) Double immunohistochemical (IHC) staining of S100A4 (green) with CD11b, F4/80, or α-SMA in the liver tissue. Nuclei were counter-stained with DAPI (blue). Note that most of the S100A4+ cells were also positive for CD11b and F4/80 (yellow), but not α-SMA. Scale bar, 50 μm. (F-G) Flow cytometry analysis of the phenotypes of S100A4+ cells in the liver of S100A4+/+.GFP mice treated with 2A by staining GFP+ cells with CD11b, Ly6C and F4/80 antibodies. (H) S100A4 concentrations in the cultured supernatant of S100A4+ CD11b+ cells or S100A4− CD11b+ cells as detected by ELISA. ##p < 0.01.
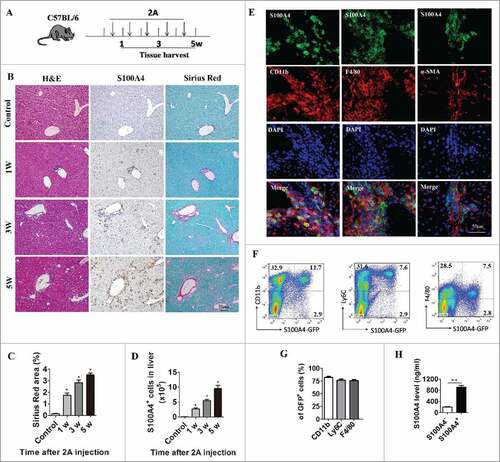
Figure 3. Selective depletion of S100A4+ cells attenuates anti-CD137 mAb-induced liver injury and liver fibrosis. S100A4-TK mice (n = 5) were treated with 100 µg 2A on day 1 and then injected with GCV or PBS on days 1, 3, 4, 6 and 7. The treatment was repeated for 4 weeks. (A) Proliferating S100A4+ cells in 2A-treated livers from S100A4-TK mice were stained for both S100A4 (red) and Ki67 (green). Arrows indicate double-positive cells (yellow). Scale bar, 50 μm. (B) Groups of S100A4-TK+ mice (n = 5 per group) were left untreated or treated with GCV to deplete S100A4+ cells, and liver sections were stained for S100A4. Scale bar, 50 μm. (C) Percentage of S100A4-positive cells. #p < 0.05. (D) Serum ALT levels of S100A4-TK+ mice treated with or without 2A. #p < 0.05. (E) The content of S100A4, MCP-1, and TNF-α protein in the liver homogenates of PBS or GCV-treated TK+ mice was measured by CBA or ELISA. #p < 0.05, ##p < 0.01. (F) Groups of S100A4-TK+ mice were left untreated or treated with GCV, and liver sections were stained with Sirius Red. Scale bar, 100μm. (G) Quantification of Sirius Red areas in the liver sections. #p < 0.05.
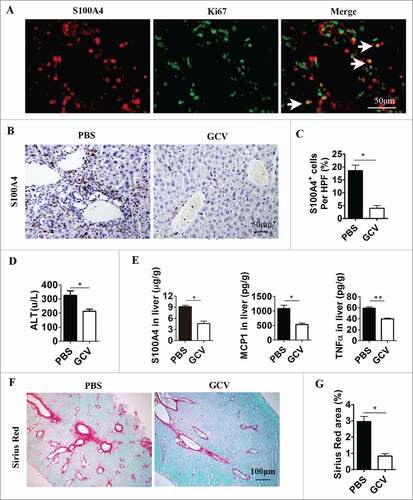
Figure 4. S100A4 deficiency attenuates long-term liver pathological effects of anti-CD137 mAb. (A) Schematic illustration of the 2A/HCC model. 15-day-old S100A4−/− or WT male mice were treated i.p. with a single injection of 50 µg/g DEN and, 1 mo later, treated with 100 µg 2A weekly for 2 mo. All mice were killed 8 mo after DEN treatment of further analysis. (B) Serum ALT levels of 2A-treated WT and S100A4−/− mice. ##p < 0.01. (C) Representative liver images of the two groups. Liver tumor nodules are indicated by arrows. (D)–(F) Liver tumor numbers, maximal tumor sizes, and liver weights are shown. ##p < 0.01. (G) Liver tissue from both groups was harvested and stained with H&E, anti-S100A4 antibodies, or Sirius Red. Scale bar, 50 μm. (H) Schematic illustration of the 2A/HCC model in S100A4-TK transgenic mice and control littermates. Mice were killed 8 mo after DEN treatment. Representative photographs of the (I) livers (J) liver tumor numbers, (K) maximal tumor sizes, and (L) liver weights. ##p < 0.01.
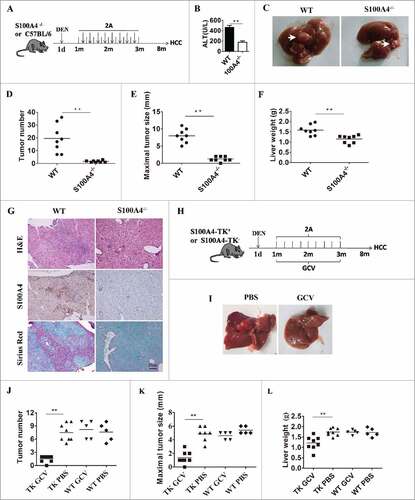
Figure 5. S100A4 potentiates CD8+ T cell survival. (A) Representative FACS data and (B) quantification of CD4+ T cells and CD8+ T cells in the liver of WT or S100A4−/− mice (treated with 2A weekly for 4 weeks) were detected by FACS, ##p < 0.01. (C) IHC staining for CD4+ and CD8+ in the liver tissue of WT and S100A4−/− mice. Scale bar, 50 μm. (D) CFSE-labeled CD4+ T and CD8+ T cells from the spleen were left unstimulated (left) or stimulated with anti-CD3 antibody (right) with or without soluble S100A4. T cell proliferation was analyzed by CFSE dilution. (E) and (F) CD4+ T and CD8+ T cells from spleen cells were stained with 7-AAD and Annexin V, and cells apoptosis was detected by FACS, ##p < 0.01.
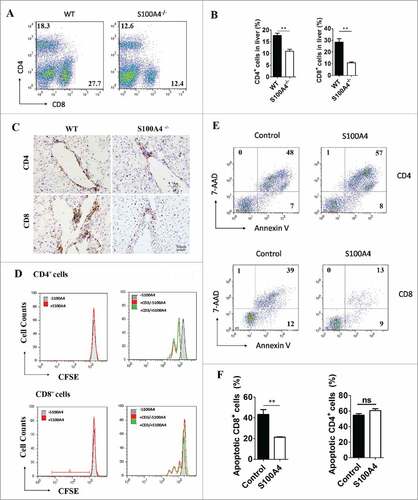
Figure 6. S100A4 inhibits CD8+ T cell apoptosis though the Akt signaling pathway. (A) CTLL-2 cells, a CD8+ murine lymphoid cell line, were cultured with or without S100A4 (1 µg/mL), or S100A4 combined with anti-S100A4 blocking mAb (6 µg/mL) for 3 d and then subjected to FACS analysis of cell apoptosis. ##p < 0.01. (B) Western blots showing the expression of cleaved caspase-3 and caspase-9. (C) CTLL-2 cells were stimulated with S100A4 for varying lengths of time, and the indicated signaling pathways were analyzed by Western blot. (D) An Erk inhibitor or Akt inhibitor was applied to the CTLL-2 culture system supplied with S100A4, and the percentage of apoptotic cells was analyzed via FACS 3 d later. Statistical data are shown (E). ##p < 0.01.
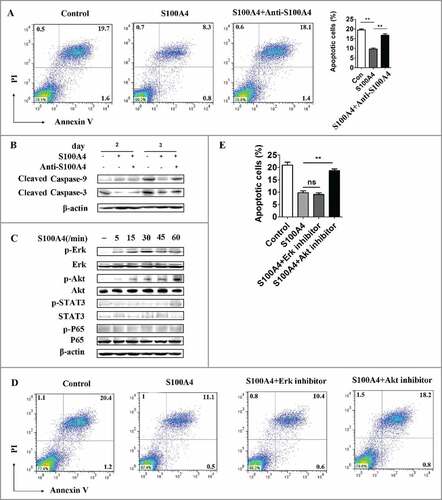
Figure 7. Targeting both the CD137 and S100A4 pathways in mice diminishes liver toxicity but retains antitumor immunity. Three groups of C57BL/six mice (n = 5 per group) were treated with RatIg, 2A, or 2A plus anti-S100A4 mAb 4 times on days 8, 11, 14, and 18. (A) The kinetics of tumor growth in these three groups are shown. ##p < 0.01. (B) Serum ALT levels in these three groups are shown. Day 0 represents the first day of 2A injection. #p < 0.05. (C) Liver tissue collected 7 or 14 d after the first injection of 2A were stained with H&E and Sirius red. Representative FACS data showing the proportions of CD4+ T cells and CD8+ T cells and statistical analysis of CD8+ T cells in the (D) tumor and (E) liver. #p < 0.05. (F) Representative IHC staining for CD8+ in tumor sections from different groups.
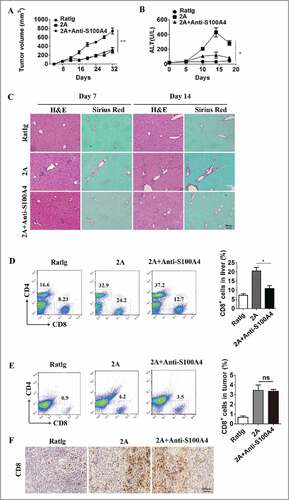
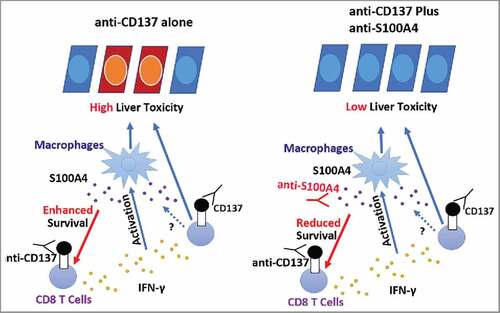
Figure 8. The role of S100A4 in anti-CD137-induced liver toxicity. CD8+ T cells, mainly the memory T cells, are activated by the anti-CD137 antibody in the liver and secrete large amounts of IFNγ, leading to the activation of macrophages and liver toxicity. During this process, large amounts of S100A4 are produced specifically inside of the liver and enhance CD8+ T cell survival, further amplifying the liver damage. Targeting S100A4 with an S100A4 blocking antibody affects CD8+ T cell survival and causes minimal liver toxicity. Similar effects could also be obtained by S100A4 deficiency or depletion of S100A4-positive macrophages.