Figures & data
Table 1. Patient demographics and clinical characteristics
Figure 1. Study design including vaccination schedule and immunomonitoring time points. During the prime phase of the trial, patients received four prime doses of VXM01 or placebo as add-on to their standard chemotherapy with gemcitabine on days 1, 3, 5, and 7. Boosting vaccination with VXM01 or placebo was started 1 mo after the last prime administration and performed following a 1× per month administration schedule, as add-on to their background therapy, i.e., gemcitabine or investigator choice on days 38 (Month 1; M1), 60 (M2), 90 (M3), 120 (M4), 150 (M5), and 180 (M6). T cell response was measured during the priming phase on days 0, 4, 14, 21, and 38, and during the boosting phase on days 48 (M1+10 d), 100 (M3+10d), 190 (M6+10d), 270 (M9), and 360 (M12). IMM, immunomonitoring.
Table 2. Incidence and cumulative number of adverse events in priming and boosting vaccination phases
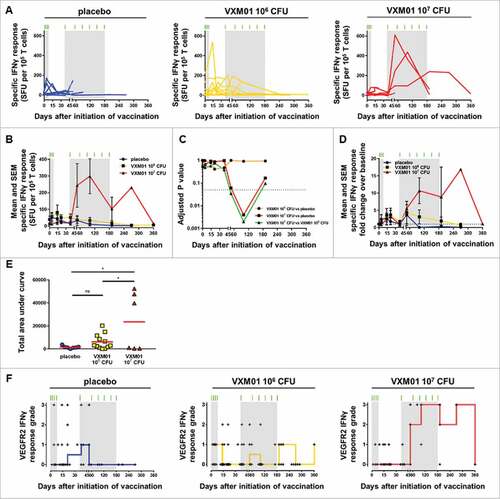
Figure 2. Analysis of the VEGFR2-specific T cell response by IFNγ ELISpot. (A) The individual and (B) mean absolute specific IFNγ T cell response to DC loaded with long synthetic peptides derived from VEGFR2, defined as the negative control subtracted from the absolute SFU count per 105 cells and per well (means of triplicates), (C) adjusted p-values obtained after multiple comparison (ANOVA) between the indicated groups at the indicated time point, and (D) fold change of the specific IFNγ T cell response over baseline level (day 0) are plotted over time. Each symbol represents the mean of the absolute specific IFNγ response (B) or the fold change over baseline level (D) at the indicated time point for all patients in the placebo (•, blue curves; N = 8), VXM01 106 CFU (■, yellow curves; N = 12), and VXM01 107 CFU (▴, red curves; N = 6) groups. Error bars represent the SEM. (E) The area under the curve was computed for the specific IFNγ T cell responses over the duration of the study in each patient. The red bar represents the mean of area under curve values for all patients in the corresponding arm. (F) The strength of treatment-associated VEGFR2-specific T cell responses was categorized for each evaluable patient and time point according to a pre-defined grading strategy, where grade 0 represents a non-significant difference between test wells and negative control wells (unpaired t-test) or no increased difference of absolute spot numbers in test and negative control wells compared with d0 and grades 1–3 represent a significant difference between test and control wells and increased difference of absolute spot numbers in VEGFR2 and negative control wells compared with day 0 < 3-fold (grade 1), ≥ 3-fold and < 5-fold (grade 2), and ≥ 5-fold (grade 3). These response grade values are plotted staggered individually over time into different panels corresponding to the indicated treatment arm. The red (VXM01 107 CFU), yellow (VXM01 106 CFU), and blue (placebo) staircase curves represent the medians of the grade values for all patients in the corresponding arm at the indicated time point. In all panels, the green tick marks and the light gray rectangles represent the vaccination, i.e., priming and boosting, time points and periods, respectively. ns: not significant, and #: statistically significant difference (p < 0.05) as determined by two-tailed t-test. CFU, colony-forming unit; SFU, spot-forming unit.