3,553
Views
63
CrossRef citations to date
0
Altmetric
Original Research

Blockade of only TGF-β 1 and 2 is sufficient to enhance the efficacy of vaccine and PD-1 checkpoint blockade immunotherapy

, ORCID Icon, ORCID Icon, , , , , & show all
Article: e1308616 | Received 06 Dec 2016, Accepted 13 Mar 2017, Published online: 16 May 2017

Figures & data

Table 1. Three anti-TGF-β clones with different affinity to each isoforms (Kd).

Figure 1. Blockade of TGF-β1 and 2 was sufficient to facilitate tumor natural immunosurveillance. BALB/c mice (five mice per group) were challenged with 5 × 105 CT26 cells. Some mice were inoculated i.p. with control human IgG (150 µg), 1D11 (100 µg), XPA068 (150 µg) or XPA089 (150 µg) three times a week for two weeks starting on the day of tumor challenge. *p = 0.0043 vs untreated group.
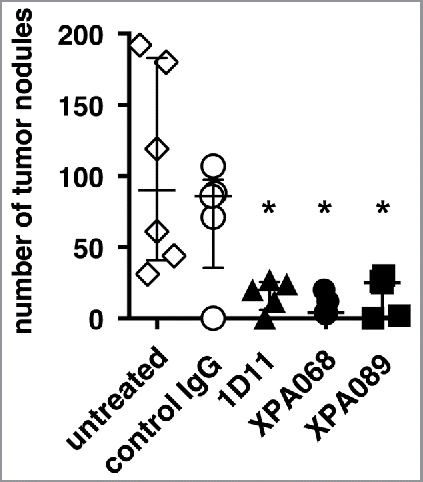
Figure 1. Blockade of TGF-β1 and 2 was sufficient to facilitate tumor natural immunosurveillance. BALB/c mice (five mice per group) were challenged with 5 × 105 CT26 cells. Some mice were inoculated i.p. with control human IgG (150 µg), 1D11 (100 µg), XPA068 (150 µg) or XPA089 (150 µg) three times a week for two weeks starting on the day of tumor challenge. *p = 0.0043 vs untreated group.

Figure 2. Blockade of TGF-β1 and 2 was sufficient to facilitate tumor immunity induced by a therapeutic cancer vaccine. When TC1 tumors in C57BL/6 mice (five mice per group) reached to >5 mm in diameter, some mice were inoculated s.c. with the vaccine based on E743–77 peptide (see Materials and methods section). Some mice received either control human IgG (150 µg, 1D11 (100 µg), XPA068 (150 µg) or XPA089 (150 µg) three times a week for two weeks starting on the day of vaccination. A, tumor progression curves of individual mouse are shown. B, averages tumor size of each group are shown. C, average tumor sizes of untreated mice and mice that received one of the anti-TGF-β antibodies alone without vaccine are shown. **p < 0.0001 vs vaccine alone group. *p < 0.05 vs vaccine alone group.
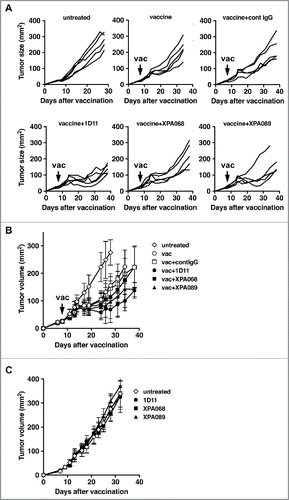
Figure 2. Blockade of TGF-β1 and 2 was sufficient to facilitate tumor immunity induced by a therapeutic cancer vaccine. When TC1 tumors in C57BL/6 mice (five mice per group) reached to >5 mm in diameter, some mice were inoculated s.c. with the vaccine based on E743–77 peptide (see Materials and methods section). Some mice received either control human IgG (150 µg, 1D11 (100 µg), XPA068 (150 µg) or XPA089 (150 µg) three times a week for two weeks starting on the day of vaccination. A, tumor progression curves of individual mouse are shown. B, averages tumor size of each group are shown. C, average tumor sizes of untreated mice and mice that received one of the anti-TGF-β antibodies alone without vaccine are shown. **p < 0.0001 vs vaccine alone group. *p < 0.05 vs vaccine alone group.

Figure 3. TGF-β blockade did not affect the numbers of Foxp3+CD4+Treg cells and CD11b+Gr-1+ cells. One week after vaccination, tumor draining lymph node cells (A) and tumor infiltrating leukocytes (B and C) were harvested and stained Foxp3+CD4+Treg cells (A and B) and CD11b+Gr-1+ cells (A and C).
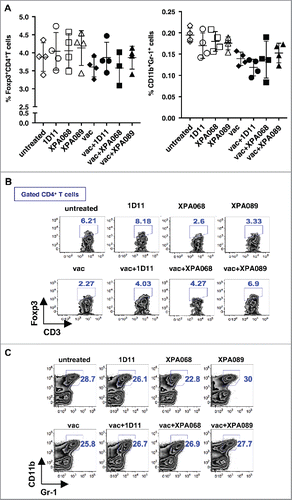
Figure 3. TGF-β blockade did not affect the numbers of Foxp3+CD4+Treg cells and CD11b+Gr-1+ cells. One week after vaccination, tumor draining lymph node cells (A) and tumor infiltrating leukocytes (B and C) were harvested and stained Foxp3+CD4+Treg cells (A and B) and CD11b+Gr-1+ cells (A and C).

Figure 4. TGF-β blockade did not change the number of type I NKT cells in tumor draining lymph nodes. A–D, one week after vaccination, type I NKT cells in tumor draining lymph nodes were analyzed for the expression of CD4+, CD44 and CD69. *p = 0.0286 vs untreated by Mann–Whitney. E, when TC1 tumors in C57BL/6 (five mice per group) reached >5 mm in diameter, some mice were inoculated s.c. with the vaccine based on E743–77 peptide (see Materials and methods section) with/without α-GalCer. Average tumor sizes of each group are shown. p < 0.0001 between untreated vs vaccine and p = 0.0017 between vaccine without α-GalCer vs vaccine groups.
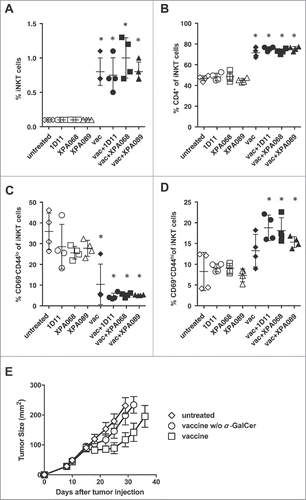
Figure 4. TGF-β blockade did not change the number of type I NKT cells in tumor draining lymph nodes. A–D, one week after vaccination, type I NKT cells in tumor draining lymph nodes were analyzed for the expression of CD4+, CD44 and CD69. *p = 0.0286 vs untreated by Mann–Whitney. E, when TC1 tumors in C57BL/6 (five mice per group) reached >5 mm in diameter, some mice were inoculated s.c. with the vaccine based on E743–77 peptide (see Materials and methods section) with/without α-GalCer. Average tumor sizes of each group are shown. p < 0.0001 between untreated vs vaccine and p = 0.0017 between vaccine without α-GalCer vs vaccine groups.

Figure 5. TGF-β blockade increased Th1 cells induced by the vaccine. A, one week after the vaccination, IFNγ production in CD4+ T cells from tumor draining lymph nodes was analyzed after PMA+ionomycin stimulation. (*p = 0.0286 vs untreated group by Mann–Whitney. p = 0.0286 vaccine alone vs vaccine + XPA068 by Mann–Whitney) In the right panel, proportions of IFNγ+CD4+ T cells of mice that received vaccine + anti-TGF-β were pooled and compared with the proportion of the cells of vaccine alone group. p = 0.0324, vaccine alone vs vaccine + anti-TGF-β. B, one week after the vaccination, T-bet and RORγ-t expression in CD4+T cells from tumor infiltrating leukocytes were analyzed. In the right panel, proportions of T-bet+CD4+ T cells of mice that received vaccine + anti-TGF-β were pooled and compared with the proportion of the cells of vaccine alone group. p = 0.025, vaccine alone vs vaccine + anti-TGF-β.
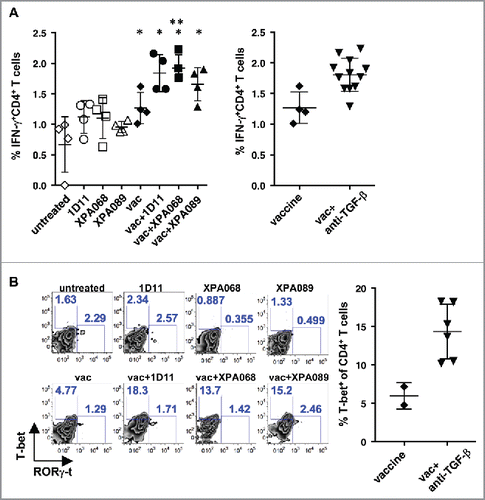
Figure 5. TGF-β blockade increased Th1 cells induced by the vaccine. A, one week after the vaccination, IFNγ production in CD4+ T cells from tumor draining lymph nodes was analyzed after PMA+ionomycin stimulation. (*p = 0.0286 vs untreated group by Mann–Whitney. p = 0.0286 vaccine alone vs vaccine + XPA068 by Mann–Whitney) In the right panel, proportions of IFNγ+CD4+ T cells of mice that received vaccine + anti-TGF-β were pooled and compared with the proportion of the cells of vaccine alone group. p = 0.0324, vaccine alone vs vaccine + anti-TGF-β. B, one week after the vaccination, T-bet and RORγ-t expression in CD4+T cells from tumor infiltrating leukocytes were analyzed. In the right panel, proportions of T-bet+CD4+ T cells of mice that received vaccine + anti-TGF-β were pooled and compared with the proportion of the cells of vaccine alone group. p = 0.025, vaccine alone vs vaccine + anti-TGF-β.

Figure 6. TGF-β blockade increased T-bet-expressing CD8+ T cells induced by the vaccine in tumors and IFNγ-producing specific CD8+ T cells in draining lymph nodes. A, one week after the vaccination, tumor antigen-specific CD8+ T cells in tumor draining lymph nodes were enumerated by using E749–57/Db-tetramers. B and C, IFNγ production in E749–57/Db-tetramer-reactive CD8+ (B) and total CD8+ T cells (C) from tumor draining lymph nodes were analyzed after PMA+ionomycin stimulation. (*p = 0.0286 vs untreated group by Mann–Whitney.) In the right panel, proportions of IFNγ+ E749–57/Db-tetramer-reactive CD8+ T cells of mice that received vaccine + anti-TGF-β were pooled and compared with the proportion of the cells of vaccine alone group. p = 0.0324. D and D, one week after the vaccination, E749–57/Db-tetramer-reactive CD8+ T cells (D) and T-bet and RORγ-t expression in CD8+T cells (E) from tumor infiltrating leukocytes were analyzed. In the right panel, proportions of T-bet+CD8+ T cells of mice that received vaccine + anti-TGF-β were pooled and compared with the proportion of the cells of vaccine alone group. p = 0.0063, vaccine alone vs vaccine + anti-TGF-β.
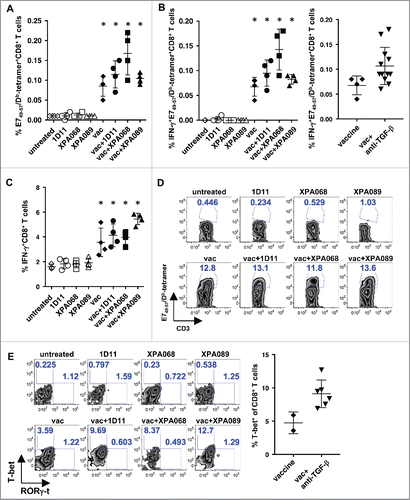
Figure 6. TGF-β blockade increased T-bet-expressing CD8+ T cells induced by the vaccine in tumors and IFNγ-producing specific CD8+ T cells in draining lymph nodes. A, one week after the vaccination, tumor antigen-specific CD8+ T cells in tumor draining lymph nodes were enumerated by using E749–57/Db-tetramers. B and C, IFNγ production in E749–57/Db-tetramer-reactive CD8+ (B) and total CD8+ T cells (C) from tumor draining lymph nodes were analyzed after PMA+ionomycin stimulation. (*p = 0.0286 vs untreated group by Mann–Whitney.) In the right panel, proportions of IFNγ+ E749–57/Db-tetramer-reactive CD8+ T cells of mice that received vaccine + anti-TGF-β were pooled and compared with the proportion of the cells of vaccine alone group. p = 0.0324. D and D, one week after the vaccination, E749–57/Db-tetramer-reactive CD8+ T cells (D) and T-bet and RORγ-t expression in CD8+T cells (E) from tumor infiltrating leukocytes were analyzed. In the right panel, proportions of T-bet+CD8+ T cells of mice that received vaccine + anti-TGF-β were pooled and compared with the proportion of the cells of vaccine alone group. p = 0.0063, vaccine alone vs vaccine + anti-TGF-β.

Figure 7. CD8+ cells were necessary for the protection induced by the vaccine + anti-TGF-β. When TC1 tumors in C57BL/6 mice (five mice per group) reached >5 mm in diameter, some mice were inoculated s.c. with the vaccine based on the E743–77 peptide (see Materials and methods section). Some vaccinated mice also received either XPA089 (150 µg) alone or XPA089 three times a week for two weeks starting on the day of vaccination and anti-CD8+ (100 µg) on days 0, 1, 7 after vaccination. A, tumor progression curves of individual mice are shown. B, average tumor sizes of each group are shown.
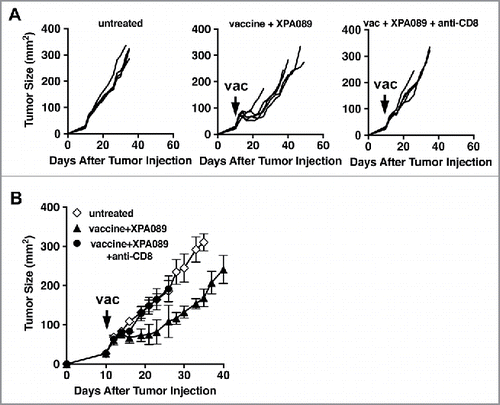
Figure 7. CD8+ cells were necessary for the protection induced by the vaccine + anti-TGF-β. When TC1 tumors in C57BL/6 mice (five mice per group) reached >5 mm in diameter, some mice were inoculated s.c. with the vaccine based on the E743–77 peptide (see Materials and methods section). Some vaccinated mice also received either XPA089 (150 µg) alone or XPA089 three times a week for two weeks starting on the day of vaccination and anti-CD8+ (100 µg) on days 0, 1, 7 after vaccination. A, tumor progression curves of individual mice are shown. B, average tumor sizes of each group are shown.

Figure 8. Expression of PD-1 on CD8+ T cells in draining lymph nodes did not change with TGF-β blockade. One week after the vaccination, the expression of PD-1 and Tim-3 on CD8+ T cells (A) and E749–57-specific CD8+ T cells (B) was analyzed. (*p = 0.0286 vs untreated group by Mann–Whitney.)
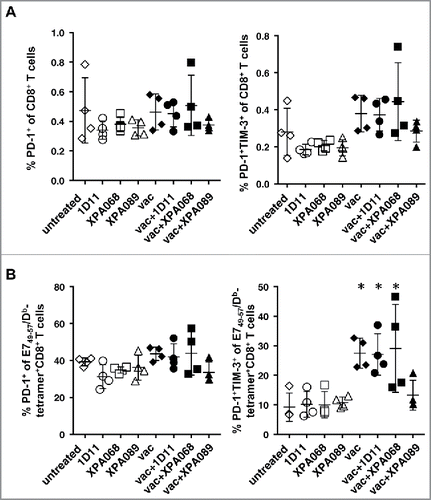
Figure 8. Expression of PD-1 on CD8+ T cells in draining lymph nodes did not change with TGF-β blockade. One week after the vaccination, the expression of PD-1 and Tim-3 on CD8+ T cells (A) and E749–57-specific CD8+ T cells (B) was analyzed. (*p = 0.0286 vs untreated group by Mann–Whitney.)

Figure 9. The combination of anti-TGF-β and anti-PD-1 further enhanced the efficacy of the therapeutic tumor vaccine. When TC1 tumors in C57BL/6 mice reached >5 mm in diameter, some mice were inoculated s.c. with the vaccine based on E743–77 peptide (see Materials and methods section). Some mice received either XPA089 (150 µg) and/or anti-PD-1 (100 µg) three times a week for two weeks starting on the day of vaccination. A, Tumor progression curves of individual mice are shown. B, average tumor sizes of each group are shown. See statistical analysis in Results.
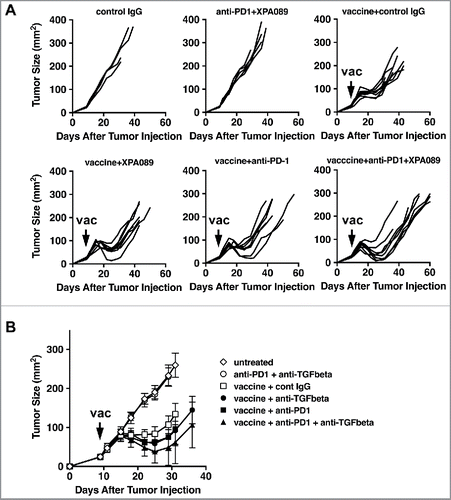
Figure 9. The combination of anti-TGF-β and anti-PD-1 further enhanced the efficacy of the therapeutic tumor vaccine. When TC1 tumors in C57BL/6 mice reached >5 mm in diameter, some mice were inoculated s.c. with the vaccine based on E743–77 peptide (see Materials and methods section). Some mice received either XPA089 (150 µg) and/or anti-PD-1 (100 µg) three times a week for two weeks starting on the day of vaccination. A, Tumor progression curves of individual mice are shown. B, average tumor sizes of each group are shown. See statistical analysis in Results.

Figure 10. PD-L1 expression in tumors was low but was upregulated by the vaccine. When TC1 tumors in C57BL/6 mice reached >5 mm in diameter, some mice were inoculated s.c. with the vaccine based on E743–77 peptide (see Materials and methods section) with/without anti-TGF-β (XPA089). A week after the vaccination, tumors were harvested and stained against PD-L1. A, Percentages of PD-L1 positive area out of total tumor area. B, Representative microscopic images of tumor sections with low (upper panels) and high (lower panels) magnification. Isotype staining: tumor section stained with an isotype control antibody. *p<0.05, **p<0.01.
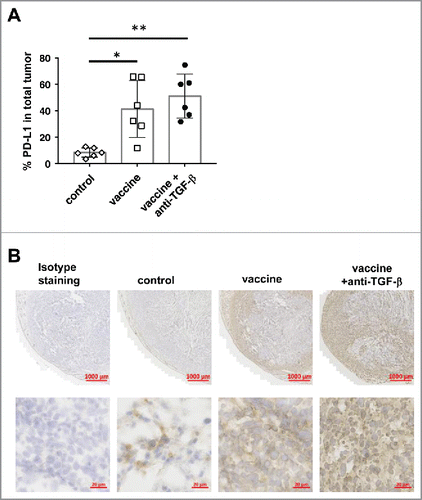
Figure 10. PD-L1 expression in tumors was low but was upregulated by the vaccine. When TC1 tumors in C57BL/6 mice reached >5 mm in diameter, some mice were inoculated s.c. with the vaccine based on E743–77 peptide (see Materials and methods section) with/without anti-TGF-β (XPA089). A week after the vaccination, tumors were harvested and stained against PD-L1. A, Percentages of PD-L1 positive area out of total tumor area. B, Representative microscopic images of tumor sections with low (upper panels) and high (lower panels) magnification. Isotype staining: tumor section stained with an isotype control antibody. *p<0.05, **p<0.01.

Reprints and Corporate Permissions

Please note: Selecting permissions does not provide access to the full text of the article, please see our help page How do I view content?

To request a reprint or corporate permissions for this article, please click on the relevant link below:

Academic Permissions

Please note: Selecting permissions does not provide access to the full text of the article, please see our help page How do I view content?

Obtain permissions instantly via Rightslink by clicking on the button below:

If you are unable to obtain permissions via Rightslink, please complete and submit this Permissions form. For more information, please visit our Permissions help page.