Figures & data
Figure 1. Combination of Cis-MPs and LDI generates better tumor treatment outcomes. (A) BALB/c mice were pre-inoculated with 2 × 10⁵ H22 tumor cells. When the tumor reached 8 × 8 mm, mice were received LDI or i.v. injected with cisplatin-packaging MPs alone or combination treatment. Tumor volumes were measured and calculated every day. Data are representative of three independent experiments, and error bars represent means ± SEM, n = 8, #p < 0.05, LDI + Cisplatin-MPs group compared with other groups. (B) Tumor volumes of CT-26 colon and Lewis lung cancer were measured and calculated every day. Data are representative of three independent experiments, and error bars represent means ± SEM, n = 8, ##p < 0.01, ###p < 0.001, LDI + Cisplatin-MPs group compared with other groups. (C) The percentage of surviving mice was analyzed by Log-rank test, n = 8, ###p < 0.001, LDI + Cisplatin-MPs group compared with other groups. (D) Weight of mice was measured every day. Data are representative of three independent experiments, and error bars represent means ± SEM, n = 8, N.S., not statistically significant, LDI + Cisplatin-MPs group compared with other groups. (E) Serum levels of creatinine and glutamic-pyruvate transaminase was detected. Data are representative of three independent experiments, and error bars represent means ± SEM, N.S., not statistically significant, LDI + Cisplatin-MPs group compared with other groups.
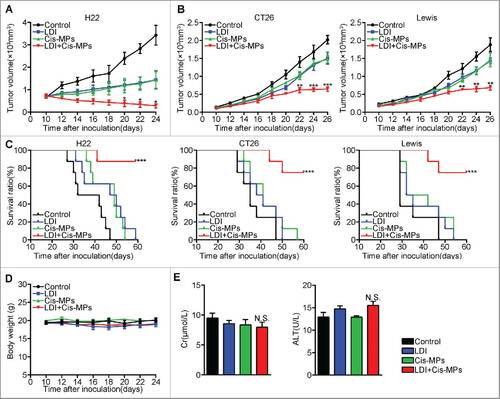
Figure 2. T cells are required to mediate the antitumor effect of Cis-MPs and LDI. (A) BALB/c mice were s.c. inoculated with 2 × 10⁵ H22 tumor cells, followed by 2 × 2 Gy irradiation treatment when tumor reached 8 × 8 mm. Apoptosis of tumor cells in tumor tissues was analyzed by flow cytometry. Data are representative of three independent experiments, and error bars represent means ± SEM, N.S., not statistically significant. (B) Nude mice, pre-inoculated with H22 tumor cells, were received LDI and i.v. injected with cisplatin-packaging MPs. Tumor volumes were measured and calculated every day. Data are representative of three independent experiments, and error bars represent means ± SEM, n = 8, N.S., not statistically significant. BALB/c mice, pre-inoculated with H22 tumor cells, were received LDI and i.v. injected with cisplatin-packaging MPs. Meanwhile, a treatment group was treated with CD3 antibody at 4-d intervals before and after tumor inoculation. Tumor volumes were measured and calculated every day. Data are representative of three independent experiments, and error bars represent means ± SEM, n = 6, #p < 0.05, ##p < 0.01, CD3 depletion group compared with LDI + Cisplatin-MPs group. (C) Similar setting as in B but treated with CD4, −CD8 antibody. Tumor volumes were measured and calculated every day. Data are representative of three independent experiments, and error bars represent means ± SEM, n = 6, #p < 0.05, ##p < 0.01, CD4, CD8 depletion group compared with LDI + Cisplatin-MPs group. (D) BALB/c mice were pre-inoculated with 2 × 10⁵ H22 tumor cells. When the tumor reached 8 × 8 mm, mice were received LDI or i.v. injected with cisplatin-packaging MPs alone or combination treatment. Leukocytes in the tumor tissues (up) and spleen (down) were isolated in each groups, and the number of infiltrating CD3+ T cells was analyzed by flow cytometry. Data are representative of three independent experiments, and error bars represent means ± SEM, #p < 0.05, LDI + Cisplatin-MPs group compared with other groups. (E) Analysis of IFNγ expression of tumor-infiltrating leukocytes (up) and splenocytes (down) using flow cytometry (left) and ELISA kit (right); data are representative of three independent experiments, and error bars represent means ± SEM, #p < 0.05, LDI + Cisplatin-MPs group compared with other groups.
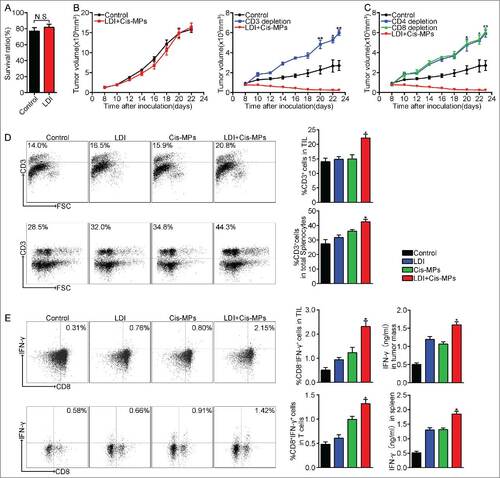
Figure 3. Macrophages are required for the antitumor T cell immunity by Cis-MPs and LDI. (A) BALB/c mice, pre-inoculated with H22 tumor cells, were received LDI and i.v. injected with cisplatin-packaging MPs. Meanwhile, a treatment group was treated with clodronate liposomes at 4-d intervals before and after tumor inoculation. Tumor volumes were measured and calculated every day. Data are representative of three independent experiments, and error bars represent means ± SEM, n = 6, #p < 0.05, LDI + Cisplatin-MPs group compared with other groups. (B) Leukocytes in the above spleen (up) and tumor tissues (down) were isolated in each groups, and the number of infiltrating CD3+ T cells was analyzed by flow cytometry. Data are representative of three independent experiments, and error bars represent means ± SEM, #p < 0.05, LDI + Cisplatin-MPs group compared with other groups. (C) Analysis of IFNγ expression of splenocytes (up) and tumor-infiltrating leukocytes (down) using flow cytometry. Data are representative of three independent experiments, and error bars represent means ± SEM, #p < 0.05, ##p < 0.01, LDI + Cisplatin-MPs group compared with other groups. (D) BALB/c mice were pre-inoculated with 2 × 10⁵ H22 tumor cells. When the tumor reached 8 × 8 mm, mice were received LDI or i.v. injected with cisplatin-packaging MPs alone or combination treatment. Leukocytes in the spleen were isolated in each groups, and the number of CD11b+F4/80+IL-1β+ (up) and CD11b+F4/80+IL-10+ (down) cells were analyzed by flow cytometry. Data are representative of three independent experiments, and error bars represent means ± SEM, #p < 0.05, ##p < 0.01, LDI + Cisplatin-MPs group compared with other groups. (E) Similar setting as in D but the tumor-infiltrating leukocytes were isolated from tumor tissues, and the number of CD11b+F4/80+IL-1β+ (up) and CD11b+F4/80+IL-10+ (down) cells were analyzed by flow cytometry. Data are representative of three independent experiments, and error bars represent means ± SEM, #p < 0.05, ##p < 0.01, LDI + Cisplatin-MPs group compared with other groups.
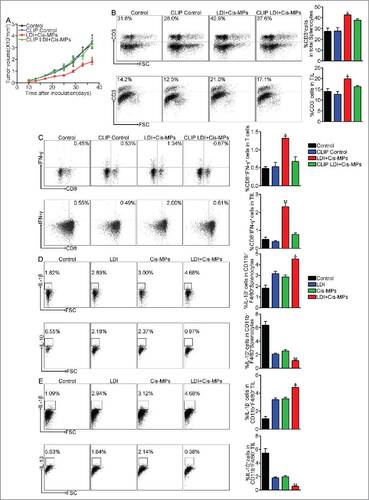
Figure 4. Macrophages remodel tumor microenvironment after the combined treatment with Cis-MPs and LDI. (A–C) BALB/c mice, pre-inoculated with H22 tumor cells, were received LDI and i.v. injected with cisplatin-packaging MPs. Meanwhile, a treatment group was treated with clodronate liposomes at 4-d intervals before and after tumor inoculation. The splenocytes and bone marrow cells were harvested from H22 tumor-bearing mice and analyzed by flow cytometry. Data are representative of three independent experiments, and error bars represent means ± SEM, #p < 0.05, LDI + Cisplatin-MPs group compared with other groups. (D) Tumor mass lysates (up) and serum (down) in the above animals were isolated and GM-CSF (left) and VEGF (right) expression were analyzed using ELISA kit. Data are representative of three independent experiments, and error bars represent means ± SEM, #p < 0.05, LDI + Cisplatin-MPs group compared with other groups. (E) Expression of RANTES (left) and TARC (right) of tumor mass lysates (up) and serum (down) was analyzed by ELISA kit. Data are representative of three independent experiments, and error bars represent means ± SEM, #p < 0.05, LDI + Cisplatin-MPs group compared with other groups. (F) Ratio of RANTES/TARC in tumor mass lysates (up) and serum (down) were calculated. Data are representative of three independent experiments, and error bars represent means ± SEM, #p < 0.05, LDI + Cisplatin-MPs group compared with other groups.
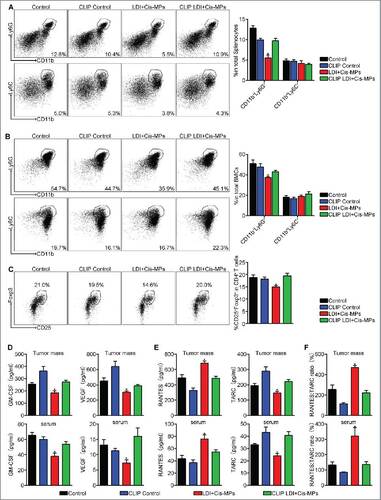
Figure 5. Combination of Cis-MPs and LDI effectively abrogates tumor-repopulating cells. (A) BALB/c mice were s.c. inoculated with 2 × 10⁵ H22 tumor cells, followed by 2 × 2 Gy irradiation treatment when tumor reached 8 × 8 mm. Macrophages were analyzed for cell-surface expression of the indicated molecules 24 h later by flow cytometry. Data are representative of three independent experiments, and error bars represent means ± SEM, N.S., not statistically significant. (B) H22, CT26 and Lewis cell lines were incubated with Cisplatin, Cisplatin-MPs and different concentrations of Cisplatin-MPs, respectively. Apoptosis of tumor cells was analyzed by flow cytometry. Data are representative of three independent experiments, and error bars represent means ± SEM, ##p < 0.01, ###p < 0.001, compared with control. (C) H22 cell lines were irradiated with different dose, apoptosis of tumor cells was analyzed by flow cytometry, data are representative of three independent experiments, and error bars represent means ± SEM, ###p < 0.001, compared with control. H22 cell lines were incubated with Cisplatin-MPs after irradiated with 4 Gy, survival ratio of tumor cells was detected by CCK-8, data are representative of three independent experiments, and error bars represent means ± SEM, ###p < 0.001, LDI + Cisplatin-MPs group compared with other groups. (D) H22 cell lines were irradiated with 4 Gy, then incubated with Cisplatin, MPs and Cisplatin-MPs, respectively, apoptosis of tumor cells was analyzed by flow cytometry. Data are representative of three independent experiments, and error bars represent means ± SEM, ##p < 0.01, LDI + Cisplatin-MPs group compared with other groups. (E) Single H22 cell purified from tumor-bearing mice grew into a multicellular tumor spheroid in 3D fibrin on day 10. Scale bar, 20 μm. (F) Colony number (left) and the colony size (right) of TRCs derived from tumor-bearing mice were measured. Data are representative of three independent experiments, and error bars represent means ± SEM, ##p < 0.01, ###p < 0.001, LDI + Cisplatin-MPs group compared with other groups. (G) PKH67 (Green)-conjugated MPs were i.v. injected to H22 subcutaneous tumor-bearing mice alone or in combination with LDI treatment, 4 h later, tumor tissues were used for the analysis by fluorescence microscope. Scale bar, 200 μm. (H) Ten thousand isolated tumor cells were collected for flow cytometric analysis of PKH67-positive population. Data are representative of three independent experiments, and error bars represent means ± SEM, ##p < 0.01, ###p < 0.001, unlabelled MPs group compared with other groups.
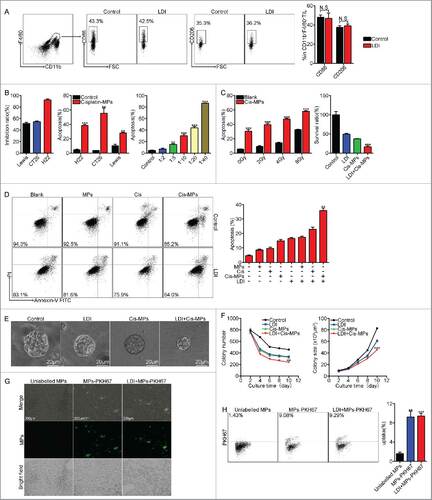
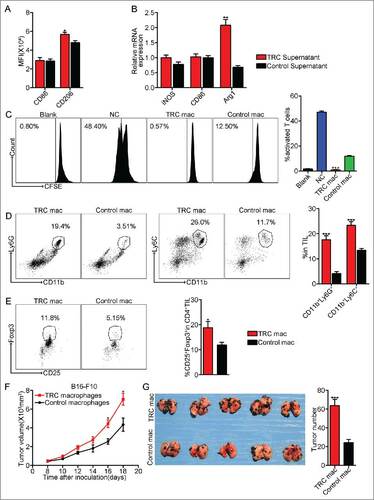
Figure 6. TRCs as a major player to polarize M2 type tumor-promoting macrophages. (A) Macrophages were incubated with the supernatants from TRCs or control tumor cells. Macrophages were analyzed for cell-surface expression of the indicated molecules 24 h later by flow cytometry and presented as the MFI. Data are representative of three independent experiments, and error bars represent means ± SEM, #p < 0.05. (B) iNOS, CD86 and Arg1 mRNAs were assessed by real-time PCR, respectively. Data are representative of three independent experiments, and error bars represent means ± SEM, ##p < 0.01. (C) Splenic T cells purified from WT mice were incubated with the above macrophages. T-cell proliferation was examined by CFSE dilution assay. Data are representative of three independent experiments, and error bars represent means ± SEM, ###p < 0.001, macrophages were incubated with TRCs supernatants group compared with control group. (D–E) C57BL/6 mice, pre-inoculated with B16-F10 tumor cells, were injected the above macrophages into tumor mass. Three days later, tumor-infiltrating leukocytes were isolated from tumor tissues in each groups and analyzed by flow cytometry. Data are representative of three independent experiments, and error bars represent means ± SEM, #p < 0.05, ###p < 0.001. (F) B16-F10 cell lines were incubated with the above macrophages for 24 h, then the B16-F10 cells were injected via s.c. into C57BL/6 mice. Tumor volumes were measured and calculated every day. Data are representative of three independent experiments, and error bars represent means ± SEM, n = 7, #p < 0.05. (G) Similar setting as in F but challenge with 1 × 10⁵ B16-F10 tumor cells through tail vein. Twenty-one days later, the mice were killed, and the black melanoma nodules on the lungs were measured and calculated. Data are representative of three independent experiments, and error bars represent means ± SEM, n = 6, ###p < 0.001.