Figures & data
Figure 1. TFEB is involved in the regulation of macrophage M2 polarization. (A) MΦs were isolated from tumor tissues of mice bearing 4T1 (n = 8) or EO771 (n = 8) tumors. TFEB mRNA expression in macrophages was determined by qPCR. *p < 0.05 vs. pMΦ-naive, two-tailed Student's t-test. (B) Peritoneal macrophages were cultured with or without EO771 or LLC tumor-conditioned medium (TCM) for 24 h. *p < 0.05 vs. control; two-tailed Student's t-test. (C) Western blot analysis of TFEB protein in mouse peritoneal MΦs treated as in (B). (D) TFEB expression in mouse peritoneal MΦs transduced with control shRNA lentiviruses (LV-Con) or two different TFEB shRNA lentiviruses (LV-TFEB-sh2 or LV-TFEB-sh3). *p < 0.05 vs. LV-Con; two-tailed Student's t-test. (E) Western blot analysis of TFEB in peritoneal MΦs treated as in (D). (F) Effects of TFEB knockdown using LV-TFEB-sh2 in peritoneal MΦs on the expression of M2 markers Arg-1 and YM-1 and M1 markers iNOS and TNF-α. Peritoneal MΦs were treated with IL-4 (15 ng/mL) or TCM, or LPS (10 ng/mL) for 24 h. *p < 0.05 vs. LV-Con under the same treatment; one-way ANOVA followed by the post-hoc Dunnett's test.
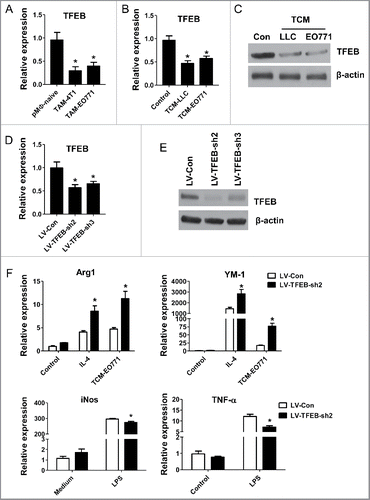
Figure 2. TGF-β decreases the expression of TFEB in macrophages. (A) Mouse peritoneal MΦs were cultured with serum-free DMEM alone (control) or with IL-4 (15 ng/mL), IL-10 (20 ng/mL), m-CSF (25 ng/mL), IL-6 (20 ng/mL), TGF-β (10 ng/mL), or EO771 tumor-conditioned medium for 24 h. TFEB expression was analyzed by qPCR. *p < 0.05 vs. control. (B) Western blot assay of TFEB in MΦs treated as in (A). (C) TGF-β concentrations in indicated media were measured by ELISA. (D) Mouse peritoneal MΦs were treated with TGF-β at various concentrations for 24 h. TFEB expression was analyzed by qPCR. *p < 0.05 vs. control (0 ng/mL TGF-β). (E) Mouse peritoneal MΦs were treated with TGF-β (10 ng/mL) or EO771 TCM in the presence or absence of TGF-β-neutralizing antibody (20 μg/mL) for 24 h, TFEB expression was analyzed by qPCR. *p < 0.05 vs. DMEM. (F) Western blot analysis of TFEB protein in MΦs treated as in (E). (G) Western blot analysis of TFEB protein levels in cytosolic or nuclear subcellular fractions of MΦs treated with IL-4 (15 ng/mL), TGF-β (10 ng/mL), or EO771 TCM. TATA-box-binding protein (TBP) and actin represent control proteins for the nuclear and cytosolic fraction, respectively. Quantification of relative intensity of the protein bands is shown under the lanes. (H) TFEB expression in mouse peritoneal MΦs treated with PD98059 (25 μM), LY294002 (40 μM), and EO771 TCM for 24 h. *p < 0.05 vs. DMEM. (I) Western blot analysis of cell lysates of peritoneal MΦs treated as in (H).
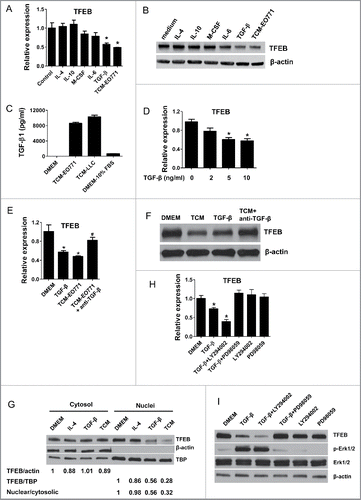
Figure 3. The effects of macrophage TFEB silencing on T-cell activation, proliferation, and tumor cell migration and proliferation. (A) Purified T-cells were labeled with CFSE, activated in vitro by CD3/CD28 and co-cultured with MΦs at the indicated T-cell:MΦ ratio for 60 h in the presence of EO771 TCM. Representative flow cytometry histograms (left) and quantitation (right) of T-cell proliferation as measured by dilution of CFSE are shown. *p < 0.05 vs. corresponding LV-Con group. (B) MΦs were transduced with control or TFEB shRNA lentiviruses and treated with LPS for 24 h. Cell surface CD86, CD80, and MHC II expression was measured by flow cytometry. Representative histograms (upper) and quantification of MFI (lower) were shown. *p < 0.05 vs. LV-Con. (C) TFEB knockdown enhanced the migration of EO771 cells. Transwell assays were performed as described in the Materials and methods section. (D) TFEB silencing in MΦs enhanced proliferation of tumor cells. EO771 cells were cultured in the presence of supernatant from LV-TFEB-sh2 or control virus transduced MΦs as described in the Methods.
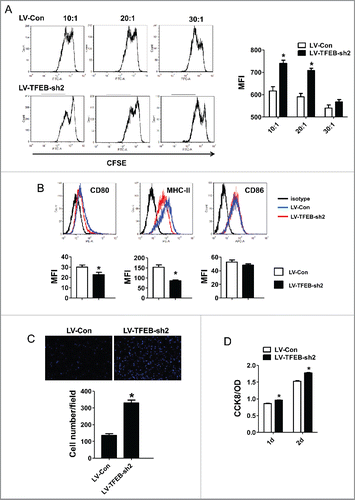
Figure 4. TFEB knockdown in macrophages promotes tumor growth in vivo. EO771 cells (A) or LLC cells (B) were injected into mice along with MΦs transduced with control or TFEB shRNA lentiviruses as described in the Materials and methods section. The tumor size was measured with a caliper at the indicated time points. Tumor volume is shown as mm3. The growth curve, representative images, and quantification of the primary tumors at the end-point are shown. Each data point represents the mean ± SD of eight mice (EO771) or five mice (LLC). *p < 0.05 vs. LV-Con; Student's t-test. (C) Percentage of F4/80+ MΦs in primary tumors at the end-point as determined by flow cytometry. *p < 0.05 vs. LV-Con; Student's t-test. Representative histograms are shown in Fig. S1A. (D) Flow cytometry analysis of CD206 expression in tumor infiltrating MΦs. (E) Percentage of CD8+ T cells in primary tumors at the end-point as determined by flow cytometry. Data are presented as the mean ± SD, *p < 0.05 vs. LV-Con; Student's t-test. Representative histograms are shown in Fig. S1B. (F) Representative immunohistochemical staining images and quantification of CD31 in EO771 tumor sections. *p < 0.05 vs. LV-Con; Student's t-test.
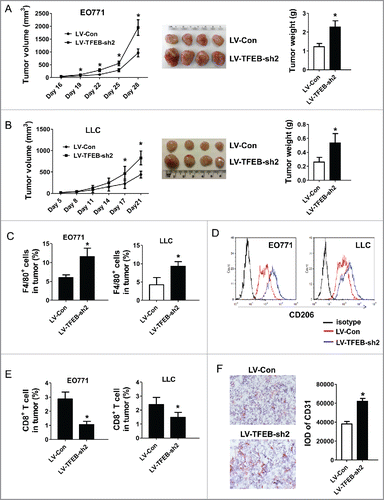
Figure 5. SOCS3-STAT3 pathway plays a key role in TFEB silencing-enhanced macrophage M2 polarization. (A) MΦs were transduced with control or TFEB shRNA lentiviruses and treated with IL-4 (15 ng/mL) or EO771 TCM for 24 h. The expression of SOCS3 was analyzed by qPCR. *p < 0.05 vs. corresponding LV-Con group. (B) Cellular proteins were analyzed by Western blot analysis after the cells were treated as in (A). (C) Cellular proteins were analyzed by Western blot analysis after MΦs were treated as in (A), with or without pretreatment with stattic (5 μM) for 2 h. (D) MΦs were treated as in (C). The expression of Arg1 and YM-1 mRNA was analyzed by qPCR. *p < 0.05 vs. corresponding control.
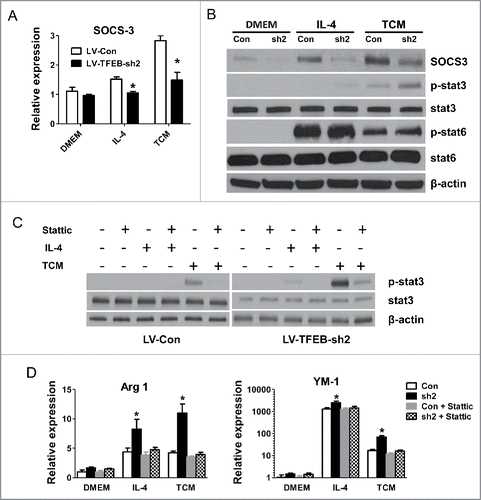
Figure 6. Activation of TFEB suppresses tumor growth in mice. (A) Western blot analysis of cytosolic and nuclear fractions obtained from MΦs treated with HPβCD for 24 h. (B) Expression of Arg1 and YM-1 in MΦs treated with IL-4 (15 ng/mL) or EO771 TCM with or without HPβCD for 24 h. (C) 4T1 cells and HPβCD-treated macrophages were co-injected into BALB/c mice. The tumor size was measured with a caliper at the indicated time points. Tumor volume is shown as mm3. Primary tumor growth curve is shown. Each data point represents the mean ± SD of 10 mice. *p < 0.05 vs. Con. (D) Representative images of primary tumors in mice at the end-point are shown (left); and tumor weight was measured and analyzed (right). (E) Effects of intraperitoneal administration of HPβCD on the tumor growth in Balb/c mice inoculated with 4T1 breast cancer cells (n = 10). Data are presented as the mean ± SD, *p < 0.05 vs. control; Student's t-test.
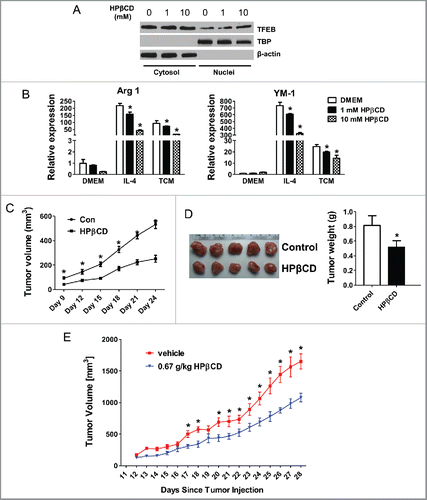
Figure 7. Macrophage specific TFEB overexpression suppressed breast tumor growth. Female C57BL/6 mice were transplanted with bone marrow cells from either control LysM-Cre mice (WT bone marrow) or macrophage specific TFEB transgenic mice (TFEBtg bone marrow) and inoculated with EO771 cells in mammary fat pads. Tumor growth curve (A) and representative tumor images and tumor weight quantification at the end point (B) are shown. Tumor tissue leukocytes were analyzed by flow cytometry. Percentage of CD45+ leukocytes in tumor cells, percentage of F4/80+ macrophages in total leukocytes, and percentage of CD206+ M2 macrophages in total macrophages (C). Mean fluorescent intensity (MFI) of CD206 in all F4/80+ cells (D), and the number of CD3+CD8+ T cells in tumor tissue (E) are shown. *p < 0.05; **p < 0.01; Student's t-test; n = 4–5.
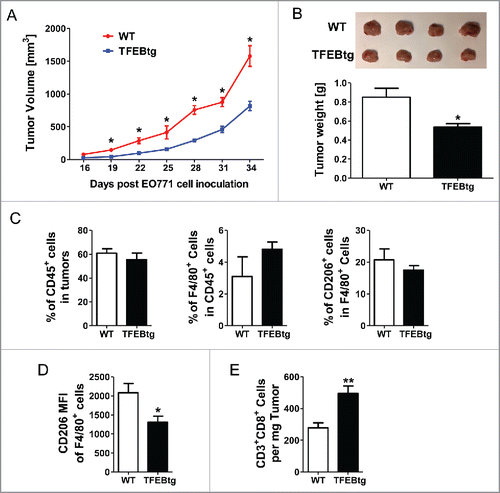
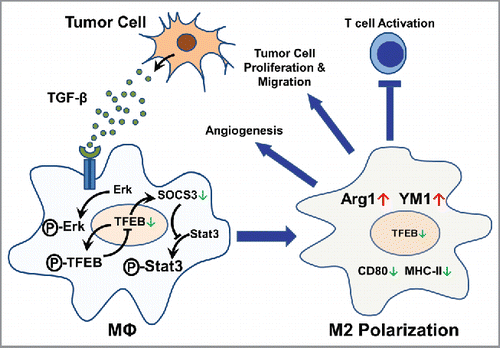
Figure 8. A model depicting the regulation and the role of TFEB in macrophage polarization in tumors.