2,740
Views
20
CrossRef citations to date
0
Altmetric
Original Research

Selective activation of anti-CD73 mechanisms in control of primary tumors and metastases

, , , , , ORCID Icon, , , & show all
Article: e1312044 | Received 15 Feb 2017, Accepted 23 Mar 2017, Published online: 08 May 2017

Figures & data

Figure 1. Biochemical characterization of anti-CD73 mAbs. (A) Affinity measurements for mouse recombinant CD73 were conducted by immobilizing mouse CD73 on a ProteOn sensor chip. Binding of anti-CD73 clones; 2C5, CD73–04, CD73–46, CD73–69 and Phen0203 (anti-human CD73 mAb) were measured by SPR. The dissociation constant values for anti-CD73 clones binding to (B) mouse or (C) human recombinant CD73 were determined. (D) Binding of anti-CD73 mAb clones to 4T1 mouse mammary carcinoma cells was determined by incubating tumor cells with serially diluted anti-CD73 mAbs or control mAbs (cIg) (1A7 and R347 as controls for mouse and human anti-CD73 mAbs, respectively), followed by incubation with secondary antibody. The median fluorescent intensity (MFI) relative to secondary antibody control is represented. (E) Epitope binning of mouse recombinant CD73 was generated using ForteBio Octet with streptavidin sensors. Biotinylated mouse recombinant CD73 was added along with a 2:1 ratio of TY-23 and anti-CD73 clones: 2C5; CD73–04; CD73–46; and CD73–69. Overlap was calculated as at least 66% drop of signal from the cross-reacting anti-CD73 antibodies.
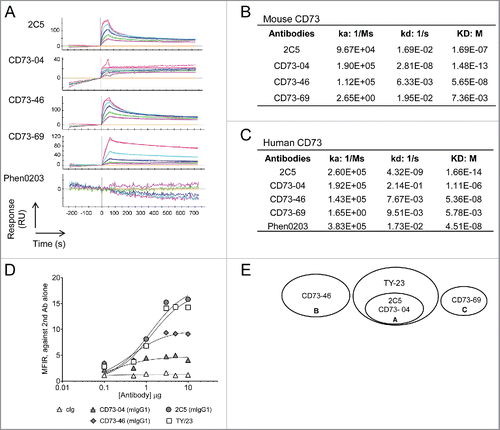
Figure 1. Biochemical characterization of anti-CD73 mAbs. (A) Affinity measurements for mouse recombinant CD73 were conducted by immobilizing mouse CD73 on a ProteOn sensor chip. Binding of anti-CD73 clones; 2C5, CD73–04, CD73–46, CD73–69 and Phen0203 (anti-human CD73 mAb) were measured by SPR. The dissociation constant values for anti-CD73 clones binding to (B) mouse or (C) human recombinant CD73 were determined. (D) Binding of anti-CD73 mAb clones to 4T1 mouse mammary carcinoma cells was determined by incubating tumor cells with serially diluted anti-CD73 mAbs or control mAbs (cIg) (1A7 and R347 as controls for mouse and human anti-CD73 mAbs, respectively), followed by incubation with secondary antibody. The median fluorescent intensity (MFI) relative to secondary antibody control is represented. (E) Epitope binning of mouse recombinant CD73 was generated using ForteBio Octet with streptavidin sensors. Biotinylated mouse recombinant CD73 was added along with a 2:1 ratio of TY-23 and anti-CD73 clones: 2C5; CD73–04; CD73–46; and CD73–69. Overlap was calculated as at least 66% drop of signal from the cross-reacting anti-CD73 antibodies.

Figure 2. Enzyme activity and internalization ability of anti-CD73 clones. (A) MDA-MB-231 or (B) 4T1 cells (1 × 10⁴ cells each) were incubated with control isotype (cIg) or anti-CD73 mAbs and AMP for (A) 6 h or (B) 8 h, respectively. Enzyme inhibition was measured using Envision after addition of ATP and Cell Titer Glo. IC50 values were determined using GraphPad Prism software. Experiment conducted in (A) included testing of all anti-CD73 mAbs and control isotypes in parallel; however, data are represented across two panels for better clarity of the individual curves. (C) Internalization of anti-CD73 mAbs (hIgG1) on MDA-MB-231 cells was performed by addition of saporin-conjugated antibodies to MDA-MB-231 cells, followed by addition of Cell Titer-Glo. Data are representative of three independent experiments and IC50 values (nM) of internalization on human (MDA-MB-231) and mouse (4T1) mammary tumor cells are shown in the table. (D) B16F10-CD73hi melanoma cells were incubated with Alexa Fluor-647 labeled 2C5 (mIgG1) or 2C5 (mIgG2a) mAbs at 37°C, 5% CO2 across several time-points of 15 min, 30 min or 60 min. Imaging was done using Zeiss AxioScop 2 microscope. Blue = DAPI, Green = Phalloidin and Red/Gray = Alexa Fluor-647 conjugated 2C5 mAb. Magnification = 20×. Scale bar = 20 µm. Images are representative from two independent experiments.
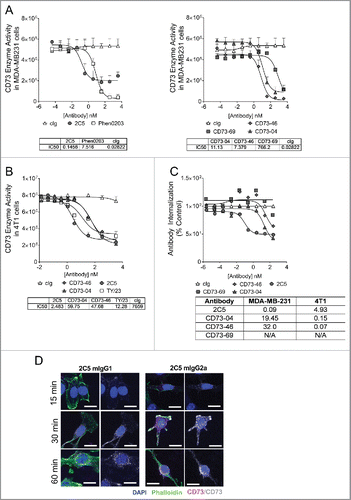
Figure 2. Enzyme activity and internalization ability of anti-CD73 clones. (A) MDA-MB-231 or (B) 4T1 cells (1 × 10⁴ cells each) were incubated with control isotype (cIg) or anti-CD73 mAbs and AMP for (A) 6 h or (B) 8 h, respectively. Enzyme inhibition was measured using Envision after addition of ATP and Cell Titer Glo. IC50 values were determined using GraphPad Prism software. Experiment conducted in (A) included testing of all anti-CD73 mAbs and control isotypes in parallel; however, data are represented across two panels for better clarity of the individual curves. (C) Internalization of anti-CD73 mAbs (hIgG1) on MDA-MB-231 cells was performed by addition of saporin-conjugated antibodies to MDA-MB-231 cells, followed by addition of Cell Titer-Glo. Data are representative of three independent experiments and IC50 values (nM) of internalization on human (MDA-MB-231) and mouse (4T1) mammary tumor cells are shown in the table. (D) B16F10-CD73hi melanoma cells were incubated with Alexa Fluor-647 labeled 2C5 (mIgG1) or 2C5 (mIgG2a) mAbs at 37°C, 5% CO2 across several time-points of 15 min, 30 min or 60 min. Imaging was done using Zeiss AxioScop 2 microscope. Blue = DAPI, Green = Phalloidin and Red/Gray = Alexa Fluor-647 conjugated 2C5 mAb. Magnification = 20×. Scale bar = 20 µm. Images are representative from two independent experiments.

Figure 3. In vivo efficacy of anti-CD73 clones in the control of primary subcutaneous tumors. (A) Nude mice were treated once by hydrodynamic tail vein injection (HTVI), 9 d after MDA-MB-231 tumor cell implantation when mean tumor volumes was approximately 75 mm3. Treatment consisted of injection of 15 μg of plasmid DNA containing clones CD73–04 (hIgG1), CD73–46 (hIgG1), CD73–69 (hIgG1) and 2C5 (hIgG1) in 100 mL/kg dose volume. (B) BALB/c mice were treated once, by HTVI, 9 d after 4T1 tumor cell implantation when mean tumor volume was approximately 50 mm3. Treatment consisted of injection of 15 μg of plasmid DNA containing clones CD73–04 (mIgG1), CD73–46 (mIgG1) and 2C5 (mIgG1) in 100 mL/kg dose volume. Mice were randomized and sorted into groups based on tumor size and were infused rapidly (∼ seconds) via the tail vein. (C) BALB/c mice were injected subcutaneously with 1 × 10⁵ CT26 colon carcinoma cells. On days 6, 9, 12 and 15 after tumor inoculation, mice were treated with either cIg (IA7, 250 μg i.p.) or anti-CD73 mAbs (CD73–04 (mIgG1), CD73–46 (mIgG1), 2C5 (mIgG1) or 2C5 (mIgG2a), 250 μg each i.p.) or APCP (20 mg/kg, i.p.). Data is shown as mean ± SEM of one experiment with (A–B) 10 mice/group or (C) 5 mice/group. p-values were determined by one-way ANOVA followed by Tukey's multiple comparison test (*p < 0.05; ***p < 0.001, ****p < 0.0001).
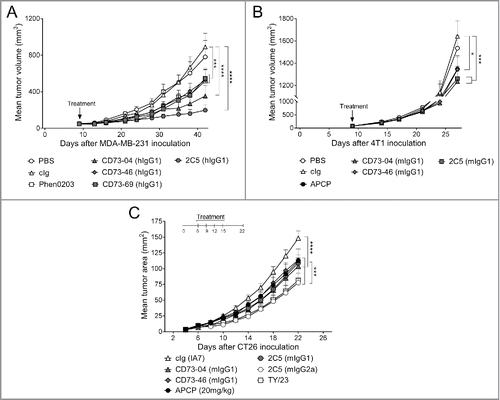
Figure 3. In vivo efficacy of anti-CD73 clones in the control of primary subcutaneous tumors. (A) Nude mice were treated once by hydrodynamic tail vein injection (HTVI), 9 d after MDA-MB-231 tumor cell implantation when mean tumor volumes was approximately 75 mm3. Treatment consisted of injection of 15 μg of plasmid DNA containing clones CD73–04 (hIgG1), CD73–46 (hIgG1), CD73–69 (hIgG1) and 2C5 (hIgG1) in 100 mL/kg dose volume. (B) BALB/c mice were treated once, by HTVI, 9 d after 4T1 tumor cell implantation when mean tumor volume was approximately 50 mm3. Treatment consisted of injection of 15 μg of plasmid DNA containing clones CD73–04 (mIgG1), CD73–46 (mIgG1) and 2C5 (mIgG1) in 100 mL/kg dose volume. Mice were randomized and sorted into groups based on tumor size and were infused rapidly (∼ seconds) via the tail vein. (C) BALB/c mice were injected subcutaneously with 1 × 10⁵ CT26 colon carcinoma cells. On days 6, 9, 12 and 15 after tumor inoculation, mice were treated with either cIg (IA7, 250 μg i.p.) or anti-CD73 mAbs (CD73–04 (mIgG1), CD73–46 (mIgG1), 2C5 (mIgG1) or 2C5 (mIgG2a), 250 μg each i.p.) or APCP (20 mg/kg, i.p.). Data is shown as mean ± SEM of one experiment with (A–B) 10 mice/group or (C) 5 mice/group. p-values were determined by one-way ANOVA followed by Tukey's multiple comparison test (*p < 0.05; ***p < 0.001, ****p < 0.0001).

Figure 4. Suppression of metastasis by anti-CD73 antibodies requires the activation of FcγRIV. (A) C57BL/6 WT mice or (B) C57BL/6 WT, FcϵγR−/− and FcγRIV−/− mice were injected intravenously with 1 × 10⁵ B16F10-CD73hi melanoma cells. On days 0 and 3 after tumor inoculation, mice were treated with either cIg (1A7, 250 μg i.p.) or (A) anti-CD73 clones (TY/23, CD73–04 (mIgG1), CD73–46 (mIgG1), 2C5 (mIgG1), 2C5 (mIgG2a), 250 μg each i.p.) or (B) 2C5 (mIgG2a) (250 μg i.p.). On day 14, lungs were harvested and number of lung metastases was quantified by counting colonies on the lung surface. (C) BALB/c and C57BL/6 WT spleens were harvested from naive mice. Splenocytes were mixed in a 1:1 ratio and plated at 2 × 10⁵ cells/well. These cells were cultured in the presence of cIg (IA7) (triangles) or anti-CD73 clones (TY/23, or 2C5 (mIgG2a)) (squares) at 500 nM and 1,000 nM. After 72 h, supernatants were measured for IFNγ. (D) C57BL/6 WT and perforin gene-targeted mice (B6. pfp−/−) or (E) C57BL/6 WT mice were injected intravenously with 1 × 10⁵ B16F10-CD73hi melanoma cells. On days 0 and 3 after tumor inoculation, mice were treated with (D) cIg (250 μg i.p.) or 2C5 (mIgG2a) (250 μg i.p.) or (E) cIg (250 μg i.p.) or 2C5 (mIgG2a) (250 μg i.p.) or TY/23 (250 μg i.p.). In some experiments (D) IFNγ was neutralized in WT mice by injection with anti-IFNγ (H22, 250 μg i.p.) on days −1, 0, and 7. In (E), mice were depleted of NK cells, CD4+ and CD8+ T cells, or Tregs by treatment with anti-asGM1 (100 μg i.p.), anti-CD4/anti-CD8β (100 μg each i.p.), anti-FR4 (10 μg i.v.), respectively, on days −1, 0 and 7. At day 14, lungs were harvested and metastatic burden was quantified by counting colonies on the lung surface. (A, E) Data represented is pooled from three independent experiments while in (B, D) data are shown as mean ± SEM from one experiment with 5–10 mice/group. One-way ANOVA followed by Tukey's multiple analysis comparison was performed to determine statistical significance in A, B, D and E. In (C) paired t-test was performed. (*p < 0.05; **p < 0.01, ***p < 0.001, ****p < 0.0001).
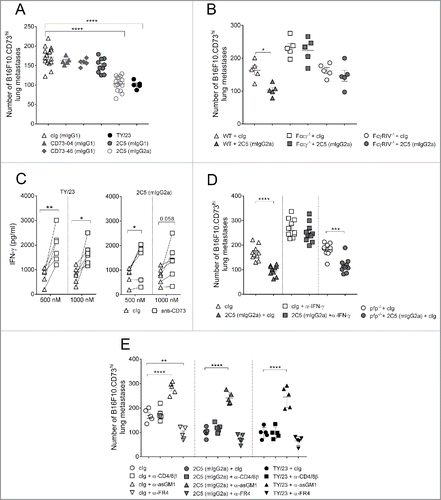
Figure 4. Suppression of metastasis by anti-CD73 antibodies requires the activation of FcγRIV. (A) C57BL/6 WT mice or (B) C57BL/6 WT, FcϵγR−/− and FcγRIV−/− mice were injected intravenously with 1 × 10⁵ B16F10-CD73hi melanoma cells. On days 0 and 3 after tumor inoculation, mice were treated with either cIg (1A7, 250 μg i.p.) or (A) anti-CD73 clones (TY/23, CD73–04 (mIgG1), CD73–46 (mIgG1), 2C5 (mIgG1), 2C5 (mIgG2a), 250 μg each i.p.) or (B) 2C5 (mIgG2a) (250 μg i.p.). On day 14, lungs were harvested and number of lung metastases was quantified by counting colonies on the lung surface. (C) BALB/c and C57BL/6 WT spleens were harvested from naive mice. Splenocytes were mixed in a 1:1 ratio and plated at 2 × 10⁵ cells/well. These cells were cultured in the presence of cIg (IA7) (triangles) or anti-CD73 clones (TY/23, or 2C5 (mIgG2a)) (squares) at 500 nM and 1,000 nM. After 72 h, supernatants were measured for IFNγ. (D) C57BL/6 WT and perforin gene-targeted mice (B6. pfp−/−) or (E) C57BL/6 WT mice were injected intravenously with 1 × 10⁵ B16F10-CD73hi melanoma cells. On days 0 and 3 after tumor inoculation, mice were treated with (D) cIg (250 μg i.p.) or 2C5 (mIgG2a) (250 μg i.p.) or (E) cIg (250 μg i.p.) or 2C5 (mIgG2a) (250 μg i.p.) or TY/23 (250 μg i.p.). In some experiments (D) IFNγ was neutralized in WT mice by injection with anti-IFNγ (H22, 250 μg i.p.) on days −1, 0, and 7. In (E), mice were depleted of NK cells, CD4+ and CD8+ T cells, or Tregs by treatment with anti-asGM1 (100 μg i.p.), anti-CD4/anti-CD8β (100 μg each i.p.), anti-FR4 (10 μg i.v.), respectively, on days −1, 0 and 7. At day 14, lungs were harvested and metastatic burden was quantified by counting colonies on the lung surface. (A, E) Data represented is pooled from three independent experiments while in (B, D) data are shown as mean ± SEM from one experiment with 5–10 mice/group. One-way ANOVA followed by Tukey's multiple analysis comparison was performed to determine statistical significance in A, B, D and E. In (C) paired t-test was performed. (*p < 0.05; **p < 0.01, ***p < 0.001, ****p < 0.0001).

Figure 5. Co-blockade of A2AR and CD73 improves anti-metastatic activity in mice. (A) C57BL/6 WT mice were injected intravenously with 1 × 10⁵ B16F10-CD73hi melanoma cells. On days 0 and 3 after tumor inoculation, mice were treated with either cIg (1A7, 250 μg i.p.) or anti-CD73 clones (CD73–04 (mIgG1), CD73–46 (mIgG1) or 2C5 (mIgG2a), 250 μg/mouse each i.p) or vehicle (DMSO) or A2AR inhibitor (SCH58261, 1 mg/kg i.p). Data is shown as mean ± SEM of 5 mice/group and p-values for panels A–C were determined by one-way ANOVA followed by Tukey's multiple comparison test. (B–D) BALB/c WT mice or (C) BALB/c perforin gene-targeted mice (BALB/c. pfp−/−) were injected in the fourth mammary fat pad with 5 × 10⁴ 4T1.2 cells. On day 17, the primary tumor was resected and mice were treated intraperitoneally with either vehicle (DMSO) or A2AR inhibitor (SCH58261, 1 mg/kg i.p.) and cIg (1A7, 250 μg i.p.) or 2C5 (mIgG2a) (250 μg i.p.) on days 18, 21, 24 and 27. In some experiments, (C) WT mice were neutralized for IFNγ by treatment with anti-IFNγ mAb (H22, 250 μg i.p.) or cIg (250 μg i.p.). (D) Depletion of NK cells, CD4+ T cells and/or CD8+ T cells were done by treating mice with anti-asGM1 (100 μg i.p.), anti-CD4 or anti-CD8β (100 μg i.p.) on days 17, 18, 25 and 32. The survival of the mice was monitored and survival analysis performed using Log-rank test. Experiment was conducted once with 5–10 mice/group. (*p < 0.05; **p < 0.01, ***p < 0.001, ****p < 0.0001).
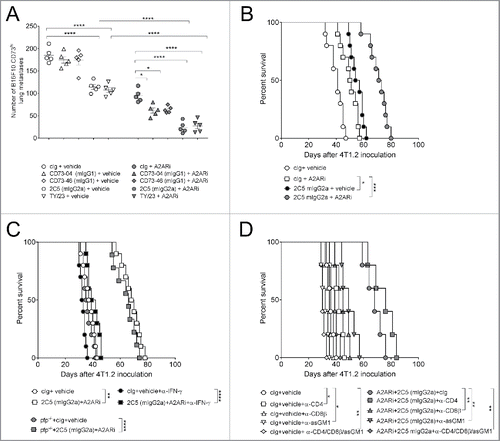
Figure 5. Co-blockade of A2AR and CD73 improves anti-metastatic activity in mice. (A) C57BL/6 WT mice were injected intravenously with 1 × 10⁵ B16F10-CD73hi melanoma cells. On days 0 and 3 after tumor inoculation, mice were treated with either cIg (1A7, 250 μg i.p.) or anti-CD73 clones (CD73–04 (mIgG1), CD73–46 (mIgG1) or 2C5 (mIgG2a), 250 μg/mouse each i.p) or vehicle (DMSO) or A2AR inhibitor (SCH58261, 1 mg/kg i.p). Data is shown as mean ± SEM of 5 mice/group and p-values for panels A–C were determined by one-way ANOVA followed by Tukey's multiple comparison test. (B–D) BALB/c WT mice or (C) BALB/c perforin gene-targeted mice (BALB/c. pfp−/−) were injected in the fourth mammary fat pad with 5 × 10⁴ 4T1.2 cells. On day 17, the primary tumor was resected and mice were treated intraperitoneally with either vehicle (DMSO) or A2AR inhibitor (SCH58261, 1 mg/kg i.p.) and cIg (1A7, 250 μg i.p.) or 2C5 (mIgG2a) (250 μg i.p.) on days 18, 21, 24 and 27. In some experiments, (C) WT mice were neutralized for IFNγ by treatment with anti-IFNγ mAb (H22, 250 μg i.p.) or cIg (250 μg i.p.). (D) Depletion of NK cells, CD4+ T cells and/or CD8+ T cells were done by treating mice with anti-asGM1 (100 μg i.p.), anti-CD4 or anti-CD8β (100 μg i.p.) on days 17, 18, 25 and 32. The survival of the mice was monitored and survival analysis performed using Log-rank test. Experiment was conducted once with 5–10 mice/group. (*p < 0.05; **p < 0.01, ***p < 0.001, ****p < 0.0001).
Supplemental material

Supplementary_Figures1-3.pdf

Download PDF (995.5 KB)

Reprints and Corporate Permissions

Please note: Selecting permissions does not provide access to the full text of the article, please see our help page How do I view content?

To request a reprint or corporate permissions for this article, please click on the relevant link below:

Academic Permissions

Please note: Selecting permissions does not provide access to the full text of the article, please see our help page How do I view content?

Obtain permissions instantly via Rightslink by clicking on the button below:

If you are unable to obtain permissions via Rightslink, please complete and submit this Permissions form. For more information, please visit our Permissions help page.