Figures & data
Figure 1. AZA reduces proliferation but increases activation of T cells and increases Treg frequency in vitro. Fresh T cells from three healthy volunteers were incubated for 12 d in technical duplicates in the presence or not of 1 µM of AZA. (A) CFSE loaded T cells were incubated for 3 d in presence of AZA (bold) or PBS (dashed) and analyzed by flow cytometry (FCM). (B–D) FCM comparisons of KI67+ (B), CD25+HLA-DR+ (C) and CD25 MFI (D) of T cells on days +4, +8, +12 in presence or not of AZA (given from day 0 to day 8). (E) Evolution of CD4+CD25+FOXP3+ Treg cells frequency among cultured CD4+ T cells receiving AZA for 4 d (red), 8 d (green) or PBS for 8 d (blue) on days +4, +8, +12, analyzed by FCM (p-values report the comparison of each time point with day +4 from the corresponding condition). Data show median values of biologic triplicates and technical duplicates (n = 6) with interquartile range (*p < 0.05, **p < 0.005, ***p < 0.0005).
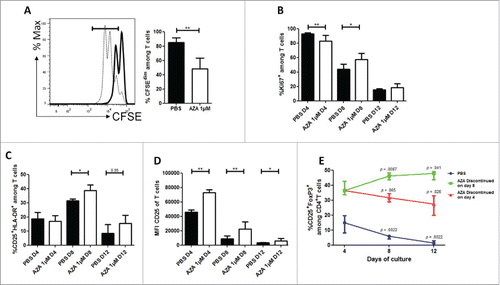
Figure 2. AZA mitigates xGVHD. NSG mice were injected with 2 × 10⁷ human PBMC i.v. and received or not AZA subcutaneously every 48 h at doses of either 2 or 5 mg/kg starting on day +1 until day +21. (A, B) Survival and GVHD scoring curves of two groups of mice transplanted with two different healthy donors (n = 12/donor) receiving PBS, 2 or 5 mg/kg of AZA (n = 8/condition). (C, D) Pooled survival and scoring curves of two groups of mice transplanted with two different healthy donors (n = 9–10/donor) receiving PBS or 5 mg/kg of AZA (n = 9–10/condition). Mice that reached a score of 6 were estimated to have terminal GVHD and were killed. Final score for dead animals reaching the ethical limit score were kept in the data set for the remaining time points (last observation carried forward). (E) Histological evaluation of tissue lesions (hematoxylin and eosin) and human CD3+ infiltrates in liver and lungs was performed at day 28 post-transplantation. In the control group, lymphoid infiltrates and endotheliitis were observed in the lungs, and portal tract expansion, endotheliitis and parenchymal alterations were observed in the liver (hematoxylin and eosin). In treated mice, both lungs and liver showed only focal infiltrates and overall subnormal histology. Immunostainings with anti-human-CD3 showed a dense infiltrate of donor lymphocytes in both organs in control animals while a very low burden of infiltrate was observed in treated mice.
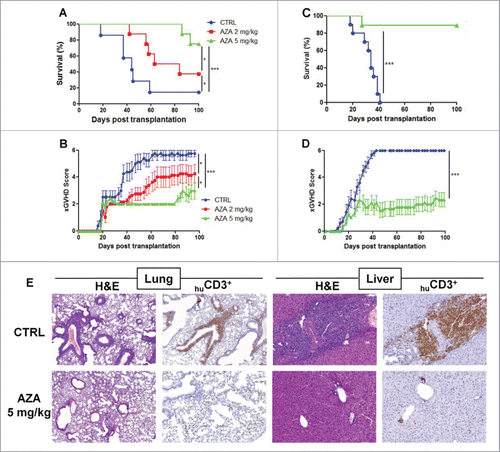
Table 1. Impact of AZA on engraftment, proliferation and immunomodulation. NSG mice were transplanted with 2 × 10⁷ human PBMC, treated or not with AZA, and FACS was performed on blood cells on day 14 or FACS and RT-qPCR were performed on spleen, blood and bone marrow cells on day 28 after sacrifice. Human chimerism was calculated as the ratio of human CD45+ cells (huCD45+) vs. murine+human CD45+ cells. CFSE dilution of huCD45+ cells was analyzed in spleen, 4 d after transplantation of 4 mice/condition with 2 × 10⁷ CFSE-loaded human PBMCs. Blood absolute counts were calculated based on white blood cell count performed with hematological cell counter (Sysmex) and hu/muCD45+ cell frequency determined by FACS. Transcript levels measured by RT-qPCR were normalized on human housekeeping gene (TBP). Data show median values of 8–10 mice/condition with interquartile range (IQR).
Figure 3. AZA increases Treg frequency and IL-2-mediated proliferation. Spleen from NSG mice transplanted with 2 × 10⁷ human PBMC and receiving or not AZA 5 mg/kg every 48 h from day +1 to +21 were harvested on day 28 and were homogenized for either flow cytometry or PCR analyses. (A) RT-qPCR comparison of FOXP3 transcript level, normalized on human housekeeping gene (TBP). (B, C) FACS comparison of CD25+FOXP3+ (in spleen and blood) and CD25+CD127lowFOXP3+ (in spleen) cell frequency within the CD4+ T cell population. (D) MS-qPCR assessment of demethylated FOXP3 intron 1 sequences performed on genomic DNA extracted from spleen homogenate of mice treated or not with AZA. (E) FACS comparison of KI67+ cell frequency within regulatory (Treg: CD4+CD25+FOXP3+, in blue) and conventional T cell (Tconv: CD4+FOXP3−, in red) populations. (F) Comparison of ratio, for each mouse treated or not with AZA, of KI67+Treg frequency vs. KI67+ Tconv frequency, based on frequencies found in . (G) FACS comparison of phosphorylated-STAT5 mean fluorescence intensity (MFI) between Treg (in blue) and Tconv (in red) in spleen. (H) Comparison of ratio, for each mouse treated or not with AZA, of pSTAT5 MFI of Treg vs. pSTAT5 MFI of Tconv, based on MFI's found in . Data show median values of 8–10 mice/condition with interquartile range (*p < 0.05, **p < 0.005, ***p < 0.0005).
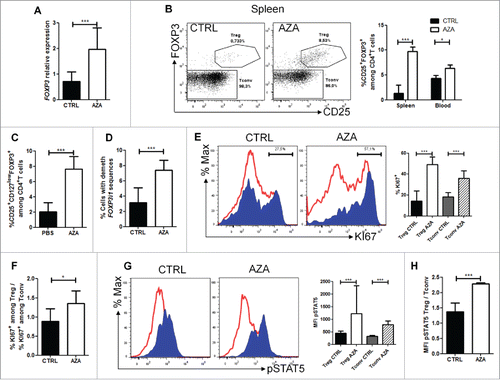
Figure 4. AZA promotes Treg suppressive activity. (A, B) Representative histograms (A) and comparative panels (B) of the suppression of CD4+CD25+CD127low Treg sorted from spleen of transplanted NSG mice, treated or not with AZA 5 mg/kg, on day 28. Treg were added to autologous CD3/CD28-stimulated Tconvs at a ratio of either 1:1, 1:4 or 1:16 (Treg:Tconv) and proliferation was measured by CFSE dilution, in triplicates. Dotted curve: Tconv alone; tinted curve: Tconv+Treg. Data show mean values of three wells/condition with SEM.
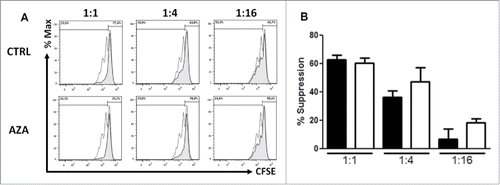
Figure 5. Absence of « chronic » GVHD development in AZA-treated mice is associated with high Treg frequency. NSG mice transplanted with 2 × 10⁷ human PBMC and receiving or not AZA 5 mg/kg were monitored for survival and GVHD score ( and ). On day 60 post-transplantation, blood was harvested from surviving mice (only AZA-treated animals) and flow cytometry was performed to evaluate Treg frequency. (A) Mice were segregated in three groups according to « chronic » GVHD symptoms and Treg frequency was compared between the groups. (B) Frequency of Treg in each mouse of the three groups.
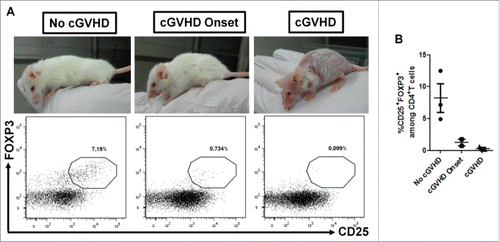
Figure 6. AZA induces long-term tolerance. Spleen from NSG mice transplanted with 2 × 10⁷ human PBMC and receiving or not AZA 5 mg/kg were harvested on day 28, were homogenized and pooled (CTRL with CTRL and AZA with AZA). Spleen homogenates were either infused per se to 2.5Gy-irradiated NSG mice (4 × 10⁶ huCD45+ cells/mouse), or were depleted of human CD25+ cells before infusion (4 × 10⁶ huCD45+ cells/mouse). (A, B) Survival and GVHD scoring curves (n = 6/condition) of mice transplanted with total spleen homogenates. (C) FACS comparison of CD25+FOXP3+ cell frequency within the CD4+ T cell population in blood at 14 and 40 d post-transplantation. (D) Survival curve (n = 6–7/condition) of mice transplanted with either total or CD25+-depleted spleen homogenates. (E) FACS comparison of CD25+FOXP3+ cell frequency within the CD4+ T cell population in blood at 14 d post-transplantation. Data show median values of 6–7 mice/condition with interquartile range (*p < 0.05, **p < 0.005, ***p < 0.0005).
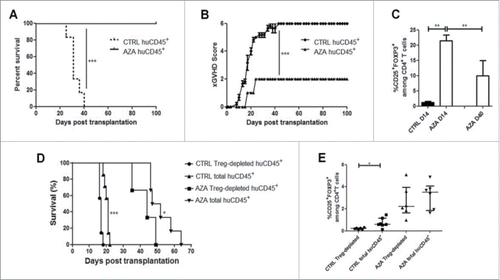
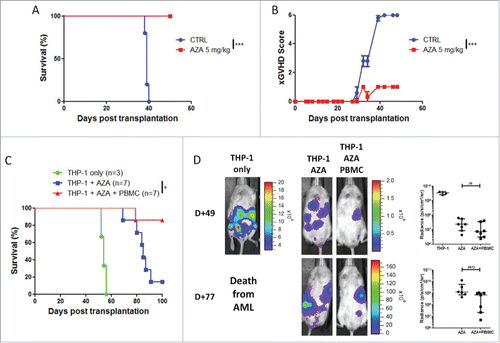
Figure 7. AZA treatment maintains graft-vs.-leukemia effect. NSG mice were transplanted with 2 × 10⁷ human PBMC together or not with 3 × 10⁶ THP-1-luc cells. Mice were either treated or not with AZA 5 mg/kg and survival (A) and bioluminescence (B) were monitored. Actual images of one representative mouse from each group are shown with Y-axis indicating photon flux (photons/sec) measured from the ventral view with a region of interest drawn over the entire body of each mouse. Right panels show the comparison of bioluminescence between groups. Data show median values of 6–7 mice/condition with interquartile range (*p < 0.05, **p < 0.005, ***p < 0.0005).
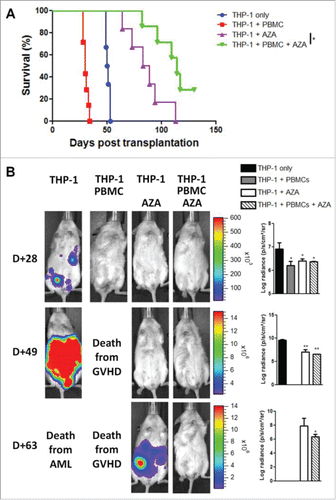
Figure 8. AZA treatment maintains graft-vs.-leukemia effect in NSG-HLA-A2/HHD mice. (A, B) NSG-HLA-A2/HHD mice were transplanted with 2 × 10⁷ human PBMC i.v. and were treated or not with AZA subcutaneously every 48 h at doses of 5 mg/kg starting on day +1 until day +21. Survival (A) and xGVHD scores (B) were monitored (n = 5–6 / condition). (C, D) NSG-HLA-A2/HHD mice were transplanted with 3 × 10⁶ THP-1-luc cells together or not with 2 × 10⁷ human PBMC. Mice were either treated or not with AZA 5 mg/kg and survival (C) and bioluminescence (D) were monitored. Actual images of one representative mouse from each group are shown with Y-axis indicating photon flux (photons/sec) measured from the ventral view with a region of interest drawn over the entire body of each mouse. Right panels show the comparison of bioluminescence between groups. Data show median values with interquartile range (*p < 0.05, **p < 0.005, ***p < 0.0005).