Figures & data
Figure 1. Timeline of the 96-week-TCZ course of the patients treated highlighting key weeks. We monthly collected clinical and laboratory data (complete blood count and chemistry panel). Disease burden was assessed by means of total-body computed tomography (CT) scan, technetium-99m methylene diphosphonate (99mTc-MDP) bone-scan, fluorine-18-2-fluoro-d-glucose positron emission tomography (FDG-PET), brain and cardiac magnetic resonance imaging (MRI) at day 0 and at week 28. Specific imaging examinations at other different timepoints were performed if considered necessary by clinical judgment. Blood samples were obtained for each patient at day 0, than monthly in order to evaluate the levels of IL-6, CXCL-8, IL-12, CXCL10, CCL-2, CCL-4, soluble-TNF receptors (TNF-Rs) before, during and after 6-mo course of therapy.
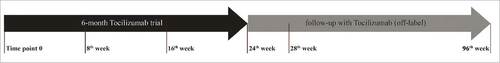
Table 1. Clinical, radiological and laboratory features of ECD patients before tocilizumab and after 24 and 96 mo of therapy. Skeletal involvement was assessed by means of FDG-PET imaging and 99mTc-MDP bone scans, thoracic and/or retroperitoneal involvement by means of high resolution CT-scan, cardiac involvement by means of cardiac cine MRI, central nervous system (CNS) and/or retro-orbital involvement by means of brain MRI, quality of life was assessed by means of health assessment questionnaire (HAQ). All the data presented in the table, with the exception of countable data, namely erythrocyte sedimentation rate (ESR) and C-reactive protein (CRP), were expressed in a semi-quantitative manner (from the worst to the best; –, +, ++, +++)
Figure 2. Skeletal involvement of patient 2 at time point 0 and at 28th week assessed by 99mTc-MDP bone scans (A) and by FDG-PET scan (B): upon treatment, humeral lesions were no longer detectable as tracer uptake or radiologic abnormalities at CT-PET, while femoral lesions improved markedly (arrows). Marked reduction of pericardial effusion (arrows) and right atrium infiltration (from 12 to 7 mm in diameter, arrowheads) in patient 1 before and after 28 week of treatment, as assessed by cardiac MRI (C). Improvement in thoracic aorta involvement and bilateral perinephric fat infiltration (arrows) in patient 1 at time point 0 and 96th week assessed by contrast enhanced CT-scan of the abdomen (D). Retro-orbital, cerebral and cerebellar disease progression in patient 3, as assessed by brain-MRI at baseline (t = 0; E, left) and after 28 weeks of tocilizumab therapy (t = 28; E, right).
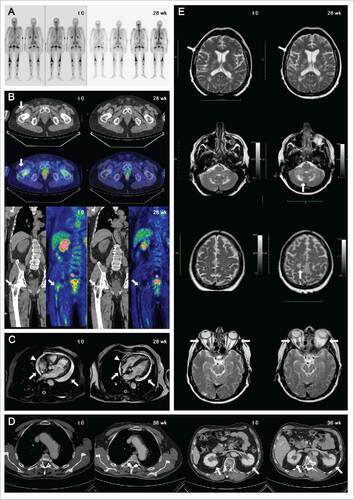
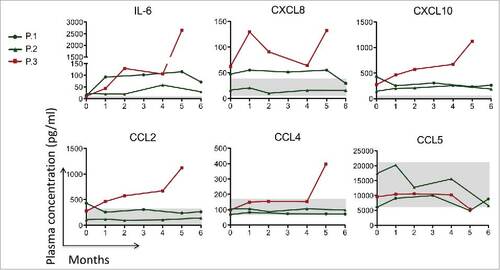
Figure 3. Circulating levels of IL-6, CXCL-8, IL-12, CXCL10, CCL-2, CCL-4 and CCL-5 before, during and after 6-month course of TCZ therapy. The gray area in the figure corresponds to the physiological concentration of every cytokine of 10 healthy controls. In patients 1 and 2 (green lines) we observed a slight reduction or stabilization of these cytokine/chemokines level. In patient 3 (red line) a worsening of all the circulating mediators except CCL5 was seen at week 20 (month 5).