1,490
Views
37
CrossRef citations to date
0
Altmetric
Original Research

A circulating TH2 cytokines profile predicts survival in patients with resectable pancreatic adenocarcinoma

, ORCID Icon, , , , , , , , , , , , & ORCID Icon show all
Article: e1322242 | Received 29 Mar 2017, Accepted 19 Apr 2017, Published online: 22 Aug 2017

Figures & data

Table 1. Characteristics of patients involved in the study.

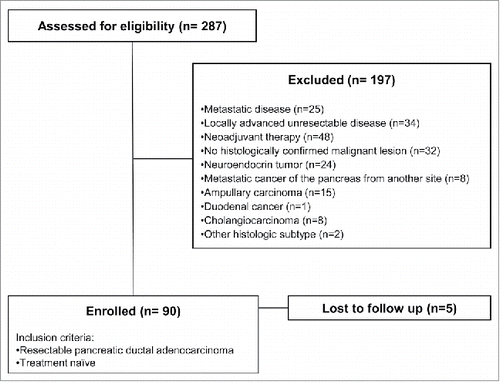
Figure 1. Strobe diagram of the study.

Figure 1. Strobe diagram of the study.

Table 2. Pre-surgical circulating cytokines levels significantly correlated with OS and DFS.

Figure 2. OS and DFS of patients with PDAC stratified according to cytokines levels. Kaplan–Meier curves for OS (A) and DFS (B) by significant cytokines cutoff concentration in plasma samples. Cytokines concentration expressed as pg/mL. (C) upper left, IL4 level in patients stratified around an early relapse cutoff of 8 mo; upper right, determination of cutoff thresholds of IL4 level for PDAC patients dichotomized according to early relapse of 8 mo. All possible cutoff thresholds were considered and the corresponding odds ratios (OR) were calculated and plotted. Each data point in the line gives the corresponding OR and 95% confidence interval (dotted lines) on the y axis. Lower left, receiver operator characteristic (ROC) curves for IL4 level in patients stratified around early relapse cutoff of 8 mo; lower right, waterfall plot, green and red bars represent cases with correct or wrong classification, respectively.
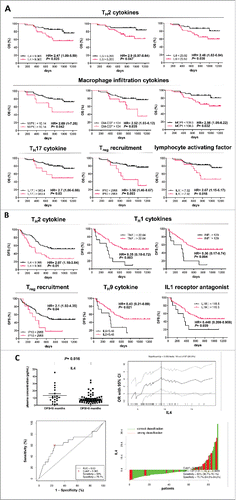
Figure 2. OS and DFS of patients with PDAC stratified according to cytokines levels. Kaplan–Meier curves for OS (A) and DFS (B) by significant cytokines cutoff concentration in plasma samples. Cytokines concentration expressed as pg/mL. (C) upper left, IL4 level in patients stratified around an early relapse cutoff of 8 mo; upper right, determination of cutoff thresholds of IL4 level for PDAC patients dichotomized according to early relapse of 8 mo. All possible cutoff thresholds were considered and the corresponding odds ratios (OR) were calculated and plotted. Each data point in the line gives the corresponding OR and 95% confidence interval (dotted lines) on the y axis. Lower left, receiver operator characteristic (ROC) curves for IL4 level in patients stratified around early relapse cutoff of 8 mo; lower right, waterfall plot, green and red bars represent cases with correct or wrong classification, respectively.

Figure 3. Combined cytokine signature predicts DFS. (A) patients were stratified for DFS on the basis of simultaneous expression of low IL4 and high TNFα. (B) tumor-immune network.
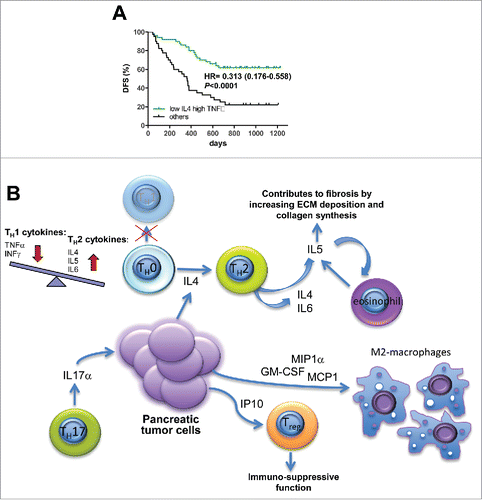
Figure 3. Combined cytokine signature predicts DFS. (A) patients were stratified for DFS on the basis of simultaneous expression of low IL4 and high TNFα. (B) tumor-immune network.

Table 3. Multivariate analysis of factors influencing OS and DFS in patients with resectable pancreatic cancer.

Supplemental material

Supplementary_materials.zip

Download Zip (298.4 KB)