960
Views
9
CrossRef citations to date
0
Altmetric
Original Research

Collagen I enhances the efficiency and anti-tumor activity of dendritic-tumor fusion cells

, , , , , , , , , , , , , , , & show all
Article: e1361094 | Received 22 Mar 2017, Accepted 24 Jul 2017, Published online: 06 Sep 2017

Figures & data

Figure 1. Col I/PEG enhanced DC/B16 cell fusion efficiency and DC maturation. To determine fusion efficiency, B16 cells were stained with CFSE and immature DCs were stained with PKH26. PEG-DC/B16 and Col I/PEG-DC/B16 fusion cell vaccines were prepared with PEG in the presence or absence of Col I. (A) Fusion efficiency was assessed according to the percentage of double positive cells. The results of one representative experiment (n = 5) are shown. (B) Quantitative analysis of flow cytometric results. The percentage of Col I/PEG-treated fusion cells was over 80%, whereas the percentage of PEG-treated fusion cells was around 22%. (C) Fusion cells were observed under a fluorescence microscope. Green fluorescence indicated B16 cells, red fluorescence indicated DCs, and blue fluorescence showed nuclei. The arrows indicated fusion cells. Original magnification, × 400. (D) Flow cytometric analysis of the expression of CD80, CD86, MHC class I, and MHC class II on CD11c+ cells. (E) ELISA detection of cytokines TNF-α, IL-6, IL-1β, IFN-β, IL-12p70 and IL-10 secreted by mature DCs. The asterisks indicated significant differences between the Col I/PEG-DC/B16 group and other groups as follows: *p < 0.05, **p < 0.01, ***p < 0.001, ****p < 0.0001, N.S. (no significant).
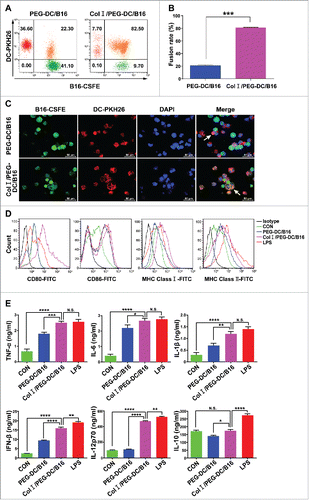
Figure 1. Col I/PEG enhanced DC/B16 cell fusion efficiency and DC maturation. To determine fusion efficiency, B16 cells were stained with CFSE and immature DCs were stained with PKH26. PEG-DC/B16 and Col I/PEG-DC/B16 fusion cell vaccines were prepared with PEG in the presence or absence of Col I. (A) Fusion efficiency was assessed according to the percentage of double positive cells. The results of one representative experiment (n = 5) are shown. (B) Quantitative analysis of flow cytometric results. The percentage of Col I/PEG-treated fusion cells was over 80%, whereas the percentage of PEG-treated fusion cells was around 22%. (C) Fusion cells were observed under a fluorescence microscope. Green fluorescence indicated B16 cells, red fluorescence indicated DCs, and blue fluorescence showed nuclei. The arrows indicated fusion cells. Original magnification, × 400. (D) Flow cytometric analysis of the expression of CD80, CD86, MHC class I, and MHC class II on CD11c+ cells. (E) ELISA detection of cytokines TNF-α, IL-6, IL-1β, IFN-β, IL-12p70 and IL-10 secreted by mature DCs. The asterisks indicated significant differences between the Col I/PEG-DC/B16 group and other groups as follows: *p < 0.05, **p < 0.01, ***p < 0.001, ****p < 0.0001, N.S. (no significant).

Figure 2. Col I/PEG-treated DC/B16 fusion cells enhanced T-cell proliferation and cytotoxic T-cell killing function. T cells isolated from the lymphocytes of C57BL/6 mouse spleens were mixed with PEG-DC/B16 and Col I/PEG-DC/B16 fusion cells separately at a ratio of 10:1. (A-C) T cells were labeled with CFSE and co-cultured with PEG-DC/B16 or Col I/PEG-DC/B16 for 5 d and the proliferation index (PtdIns) in different groups was determined. A representative experiment (n = 3) is shown. (D) The PI of the Col I/PEG-DC/B16 group was compared with the PEG-DC/B16 group and T cells alone group. (E) Determination of the killing effect of CTLs induced separately by Col I/PEG-DC/B16 or PEG-DC/B16 on 51Cr-labeled B16 cells at an effector-target ratio of 40:1, 20:1, 10:1, or 5:1. (F) Determination of the killing effect of CTLs induced separately by Col I/PEG-DC/B16 or PEG-DC/B16 on 51Cr-labeled B16 cells and 4T1 cells (as a negative control) at an effector-target ratio of 40:1. The asterisks indicated significant differences between the Col I/PEG-DC/B16 group and other groups as follows: *p < 0.05, **p < 0.01, ****p < 0.0001.
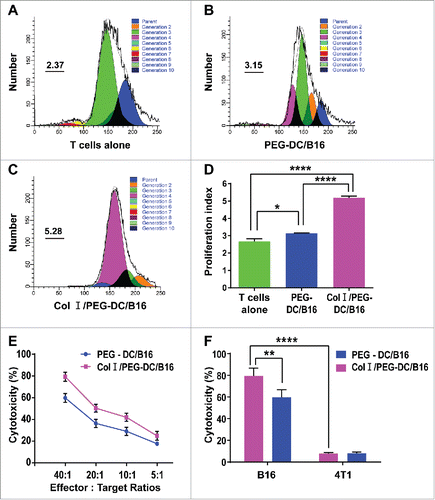
Figure 2. Col I/PEG-treated DC/B16 fusion cells enhanced T-cell proliferation and cytotoxic T-cell killing function. T cells isolated from the lymphocytes of C57BL/6 mouse spleens were mixed with PEG-DC/B16 and Col I/PEG-DC/B16 fusion cells separately at a ratio of 10:1. (A-C) T cells were labeled with CFSE and co-cultured with PEG-DC/B16 or Col I/PEG-DC/B16 for 5 d and the proliferation index (PtdIns) in different groups was determined. A representative experiment (n = 3) is shown. (D) The PI of the Col I/PEG-DC/B16 group was compared with the PEG-DC/B16 group and T cells alone group. (E) Determination of the killing effect of CTLs induced separately by Col I/PEG-DC/B16 or PEG-DC/B16 on 51Cr-labeled B16 cells at an effector-target ratio of 40:1, 20:1, 10:1, or 5:1. (F) Determination of the killing effect of CTLs induced separately by Col I/PEG-DC/B16 or PEG-DC/B16 on 51Cr-labeled B16 cells and 4T1 cells (as a negative control) at an effector-target ratio of 40:1. The asterisks indicated significant differences between the Col I/PEG-DC/B16 group and other groups as follows: *p < 0.05, **p < 0.01, ****p < 0.0001.

Figure 3. Anti-tumor activity of the Col I/PEG-treated DC/B16 fusion cell vaccine in vivo. Melanoma-bearing mice were treated with fusion cells (5 × 10⁶) induced by PEG with or without Col I, or PBS every 7 d (3 treatments) for a total of 21 d. (A) Tumor volume and (B) survival were determined. The asterisks indicated a significant difference between the Col I/PEG-DC/B16 group and the PEG-DC/B16 group (*p < 0.05). (C-E) Expression of PCNA was detected by immunohistochemistry. A representative experiment (n = 5) is shown. Original magnification, × 400. The arrows indicated the expression of PCNA. (F) Quantification of PCNA expression. (G-J) Apoptosis was analyzed by TUNEL assay and the arrows indicate apoptotic tumor cells. Original magnification, × 400. The asterisks indicated significant differences as follows: *p < 0.05, **p < 0.01, ***p < 0.001.
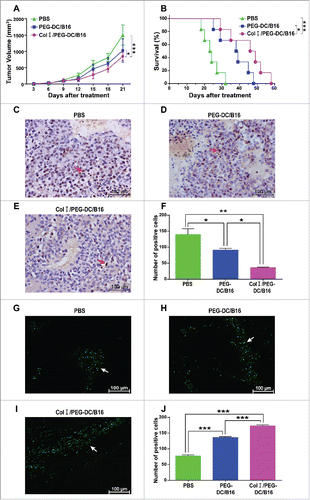
Figure 3. Anti-tumor activity of the Col I/PEG-treated DC/B16 fusion cell vaccine in vivo. Melanoma-bearing mice were treated with fusion cells (5 × 10⁶) induced by PEG with or without Col I, or PBS every 7 d (3 treatments) for a total of 21 d. (A) Tumor volume and (B) survival were determined. The asterisks indicated a significant difference between the Col I/PEG-DC/B16 group and the PEG-DC/B16 group (*p < 0.05). (C-E) Expression of PCNA was detected by immunohistochemistry. A representative experiment (n = 5) is shown. Original magnification, × 400. The arrows indicated the expression of PCNA. (F) Quantification of PCNA expression. (G-J) Apoptosis was analyzed by TUNEL assay and the arrows indicate apoptotic tumor cells. Original magnification, × 400. The asterisks indicated significant differences as follows: *p < 0.05, **p < 0.01, ***p < 0.001.

Figure 4. Col I/PEG-treated DC/B16 fusion cell vaccine decreased the suppressive immune response of melanoma-bearing mice. Melanoma-bearing mice were treated with fusion cells (5 × 10⁶) induced by PEG with or without Col I, or PBS every 7 d for a total of 21 day (3 treatments). Flow cytometric analysis was performed for CD4+ CD25+ FoxP3+ Tregs in the spleen (A, B) and MDSCs in spleen (C, D) tumor (E, F), bone marrow (G, H). A representative experiment (n = 3) is shown. The asterisks indicated significant differences between the Col I/PEG-DC/B16 group and the PEG-DC/B16 group as follows: *p < 0.05, **p < 0.01, ***p < 0.001, ****p < 0.0001, N.S. (no significant).
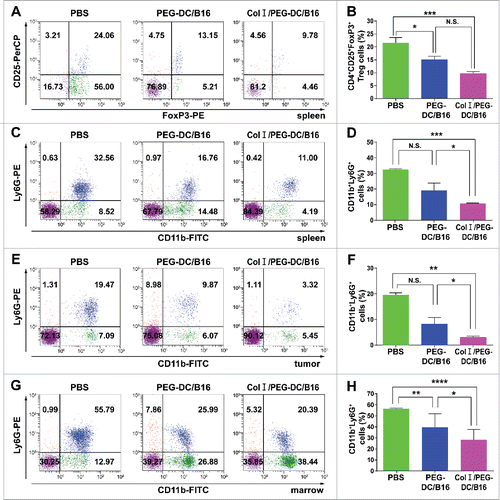
Figure 4. Col I/PEG-treated DC/B16 fusion cell vaccine decreased the suppressive immune response of melanoma-bearing mice. Melanoma-bearing mice were treated with fusion cells (5 × 10⁶) induced by PEG with or without Col I, or PBS every 7 d for a total of 21 day (3 treatments). Flow cytometric analysis was performed for CD4+ CD25+ FoxP3+ Tregs in the spleen (A, B) and MDSCs in spleen (C, D) tumor (E, F), bone marrow (G, H). A representative experiment (n = 3) is shown. The asterisks indicated significant differences between the Col I/PEG-DC/B16 group and the PEG-DC/B16 group as follows: *p < 0.05, **p < 0.01, ***p < 0.001, ****p < 0.0001, N.S. (no significant).

Figure 5. 1H NMR spectra and differentially expressed metabolites in the Col I/PEG-DC/B16 and the PEG-DC/B16 groups. (A) Four hundred permutations using 2 main components in the PLS-DA model were shown. (B) The separation of 2 main components by OPLS-DA model was shown. A representative experiment (n = 3) is shown. (C, D) Differentially expressed metabolites in 2 groups. Compared with the PEG-DC/B16 group, the lactic acid level in CI/PEG-DC/B16 cells was increased and alanine, acetic acid and glucose decreased. The asterisks indicated significant differences as follow: *p < 0.05, **p < 0.01, ****p < 0.0001.
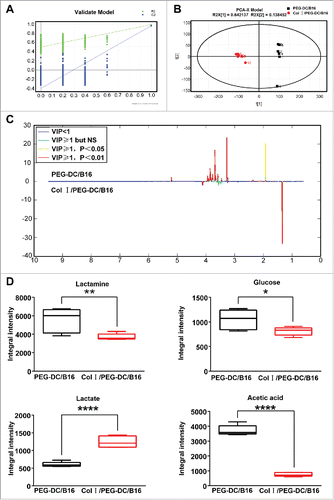
Figure 5. 1H NMR spectra and differentially expressed metabolites in the Col I/PEG-DC/B16 and the PEG-DC/B16 groups. (A) Four hundred permutations using 2 main components in the PLS-DA model were shown. (B) The separation of 2 main components by OPLS-DA model was shown. A representative experiment (n = 3) is shown. (C, D) Differentially expressed metabolites in 2 groups. Compared with the PEG-DC/B16 group, the lactic acid level in CI/PEG-DC/B16 cells was increased and alanine, acetic acid and glucose decreased. The asterisks indicated significant differences as follow: *p < 0.05, **p < 0.01, ****p < 0.0001.

Figure 6. Anti-tumor mechanism of the DC/tumor fusion cell vaccine induced by Col I/PEG. Col I/PEG promotes the expression of DC surface molecules, including CD80, CD86, CCR7, and MHC class I and II proteins, and significantly increases the secretion of lactate and cytokines IL-6, IL-1β, TNF-α, IFN-β, and IL-12p70 in fusion cells, thus promoting the maturation of DC/tumor fusion cells, enhancing the antigen presentation ability of DCs and activating T cells more efficiently, which resulted in higher anti-tumor activity.
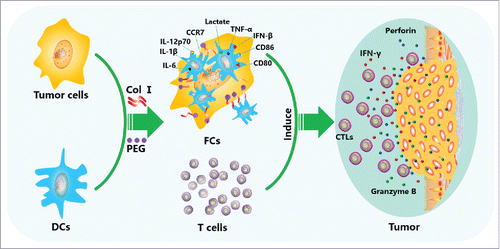
Figure 6. Anti-tumor mechanism of the DC/tumor fusion cell vaccine induced by Col I/PEG. Col I/PEG promotes the expression of DC surface molecules, including CD80, CD86, CCR7, and MHC class I and II proteins, and significantly increases the secretion of lactate and cytokines IL-6, IL-1β, TNF-α, IFN-β, and IL-12p70 in fusion cells, thus promoting the maturation of DC/tumor fusion cells, enhancing the antigen presentation ability of DCs and activating T cells more efficiently, which resulted in higher anti-tumor activity.
Supplemental material

Supplementary_materials.docx

Download MS Word (1.6 MB)

Reprints and Corporate Permissions

Please note: Selecting permissions does not provide access to the full text of the article, please see our help page How do I view content?

To request a reprint or corporate permissions for this article, please click on the relevant link below:

Academic Permissions

Please note: Selecting permissions does not provide access to the full text of the article, please see our help page How do I view content?

Obtain permissions instantly via Rightslink by clicking on the button below:

If you are unable to obtain permissions via Rightslink, please complete and submit this Permissions form. For more information, please visit our Permissions help page.