2,086
Views
56
CrossRef citations to date
0
Altmetric
Original Research

Tumor-derived exosomes educate dendritic cells to promote tumor metastasis via HSP72/HSP105-TLR2/TLR4 pathway

, , , , , , , & show all
Article: e1362527 | Received 26 Apr 2017, Accepted 26 Jul 2017, Published online: 05 Sep 2017

Figures & data

Figure 1. Ta-DCs secreted high levels of inflammatory mediators and promoted the invasion of tumor cells in vitro. (A) BMDCs were stimulated with PBS or 5 μg/ml of B16-F10-EXO, 3LL-EXO or 4T1-EXO for 6 h. Production of IL-6 and PGE2 from BMDCs was measured by ELISA (n = 3). (B) B16-F10, 3LL or 4T1 tumor cells were cultured in supernatant from corresponding exosome-stimulated BMDCs for 24 h, and the cells were plated in the top chamber of a Transwell plate. Twenty-four hours later, the cells on the bottom of the Transwell filter were imaged and quantified. (C) The results of (B) were statistically analyzed (n = 5). (D) B16-F10, 3LL or 4T1 tumor cells were cultured in supernatant from corresponding exosome-stimulated BMDCs for 24 h, and the cells were plated in the top chamber, precoated with 50 μl of Matrigel. Forty-eight hours later, the cells on the bottom of the Transwell filter were imaged and quantified. (E) The results of (D) were statistically analyzed (n = 5). (F) B16-F10, 3LL or 4T1 tumor cells were cultured in supernatant from corresponding exosome-stimulated BMDCs for 24 h, and the cells were then collected and re-cultured in fresh medium. The proliferation of tumor cells was measured using an alamarBlue assay at 24 h, 48 h and 72 h (n = 5). (A, C, E, F) The results are shown as the mean ± SEM of 3 independent experiments. (B, D) One representative image out of 5 is shown (Magnification: 200 ×). P values were generated by one-way ANOVA, followed by a Tukey-Kramer multiple comparison test; ***p < 0.001.
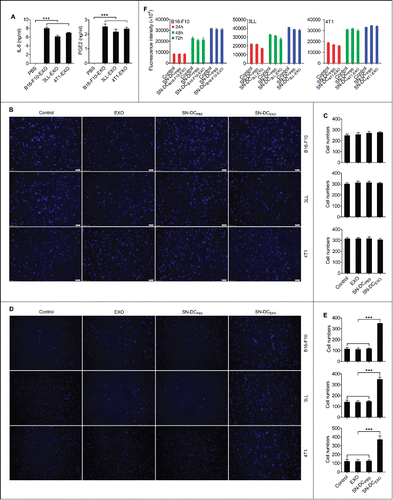
Figure 1. Ta-DCs secreted high levels of inflammatory mediators and promoted the invasion of tumor cells in vitro. (A) BMDCs were stimulated with PBS or 5 μg/ml of B16-F10-EXO, 3LL-EXO or 4T1-EXO for 6 h. Production of IL-6 and PGE2 from BMDCs was measured by ELISA (n = 3). (B) B16-F10, 3LL or 4T1 tumor cells were cultured in supernatant from corresponding exosome-stimulated BMDCs for 24 h, and the cells were plated in the top chamber of a Transwell plate. Twenty-four hours later, the cells on the bottom of the Transwell filter were imaged and quantified. (C) The results of (B) were statistically analyzed (n = 5). (D) B16-F10, 3LL or 4T1 tumor cells were cultured in supernatant from corresponding exosome-stimulated BMDCs for 24 h, and the cells were plated in the top chamber, precoated with 50 μl of Matrigel. Forty-eight hours later, the cells on the bottom of the Transwell filter were imaged and quantified. (E) The results of (D) were statistically analyzed (n = 5). (F) B16-F10, 3LL or 4T1 tumor cells were cultured in supernatant from corresponding exosome-stimulated BMDCs for 24 h, and the cells were then collected and re-cultured in fresh medium. The proliferation of tumor cells was measured using an alamarBlue assay at 24 h, 48 h and 72 h (n = 5). (A, C, E, F) The results are shown as the mean ± SEM of 3 independent experiments. (B, D) One representative image out of 5 is shown (Magnification: 200 ×). P values were generated by one-way ANOVA, followed by a Tukey-Kramer multiple comparison test; ***p < 0.001.

Figure 2. IL-6 from Ta-DCs promoted tumor cell invasion through upregulation of MMP9 expression. (A-C) B16-F10 cells were cultured in supernatant from PBS- or B16-F10-EXO (5 μg/ml for 6 h)-stimulated BMDCs in the presence of 30 μg/ml of anti-IL-6, PGE2 or isotype control (ISO) mAbs (A), or BMDCs of WT or IL-6−/− mice (B) for 24 h. Their invasive ability was measured using an in vitro invasive assay (n = 5) (A, B). The MMP2, MMP9 and MMP13 protein levels in each supernatant-treated B16-F10 cells were detected by Western blot (C). (D, E) B16-F10 cells were cultured in supernatant from B16-F10-EXO (5 μg/ml for 6 h)-stimulated BMDCs from WT or IL-6−/− mice for 24 h, and the MMP9 protein level was detected by Western blot (D), or in the presence of 600 nm MMP9 inhibitor for 24 h. Then, the invasive ability of B16-F10 cells was measured using an in vitro invasive assay (n = 5) (E). (A, B, E) The results are shown as the mean ± SEM of 3 independent experiments. (C, D) One representative of 3 independent experiments is shown. Numbers indicate the ratio of gray values of the corresponding protein to that of β-Actin. P values were generated by one-way ANOVA, followed by a Tukey-Kramer multiple comparison test; **p < 0.01; ***p < 0.001; NS, not significant.
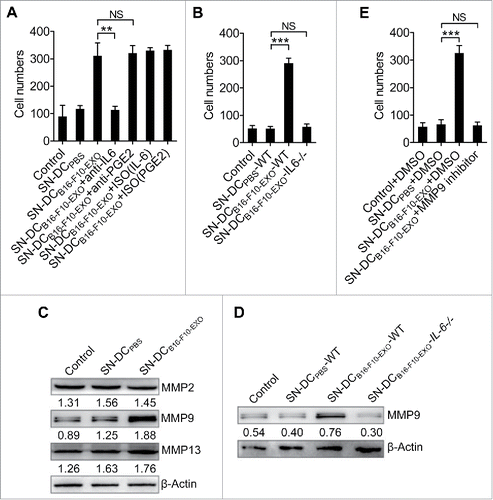
Figure 2. IL-6 from Ta-DCs promoted tumor cell invasion through upregulation of MMP9 expression. (A-C) B16-F10 cells were cultured in supernatant from PBS- or B16-F10-EXO (5 μg/ml for 6 h)-stimulated BMDCs in the presence of 30 μg/ml of anti-IL-6, PGE2 or isotype control (ISO) mAbs (A), or BMDCs of WT or IL-6−/− mice (B) for 24 h. Their invasive ability was measured using an in vitro invasive assay (n = 5) (A, B). The MMP2, MMP9 and MMP13 protein levels in each supernatant-treated B16-F10 cells were detected by Western blot (C). (D, E) B16-F10 cells were cultured in supernatant from B16-F10-EXO (5 μg/ml for 6 h)-stimulated BMDCs from WT or IL-6−/− mice for 24 h, and the MMP9 protein level was detected by Western blot (D), or in the presence of 600 nm MMP9 inhibitor for 24 h. Then, the invasive ability of B16-F10 cells was measured using an in vitro invasive assay (n = 5) (E). (A, B, E) The results are shown as the mean ± SEM of 3 independent experiments. (C, D) One representative of 3 independent experiments is shown. Numbers indicate the ratio of gray values of the corresponding protein to that of β-Actin. P values were generated by one-way ANOVA, followed by a Tukey-Kramer multiple comparison test; **p < 0.01; ***p < 0.001; NS, not significant.

Figure 3. Activation of STAT3 by IL-6 from Ta-DCs increased transcription of MMP9. (A, B) B16-F10 cells were cultured in supernatant from PBS-stimulated BMDCs of WT mice or B16-F10-EXO (5 μg/ml for 6 h)-stimulated BMDCs of WT or IL-6−/− mice for the indicated time points. Then, the p-STAT3 and STAT3 protein levels were detected by Western blot (A), or with or without 2 μM of Stattic for 6 h. Then, the MMP9 mRNA level was detected by real-time PCR (B). (C-E) B16-F10 cells were cultured in supernatant from PBS- or B16-F10-EXO (5 μg/ml for 6 h)-stimulated BMDCs with or without 2 μM of Stattic for 24 h. Then, the MMP9 protein level was detected by Western blot (C), or the cells were collected and cultured in serum-free DMEM media for another 24 h. The MMP2 and MMP9 activity in the supernatant was detected by gelatin zymography (D), or the invasive ability of B16-F10 cells was measured using an in vitro invasive assay (n = 5) (E). (F) B16-F10 cells were stimulated with or without 10 ng/ml of IL-6 for 24 h, and the binding of STAT3 and the MMP9 promoter was examined by ChIP assay. (G) NIH-3T3 cells were transfected with MMP9-luc, along with STAT3 plasmids, with or without 10 ng/ml of IL-6 stimulation. Twenty-four hours later, luciferase activity was analyzed and normalized to that of Renilla luciferase. (A, C) Numbers indicate the ratio of gray values of the corresponding protein to that of STAT3 or β-Actin. (A, C, D) One representative of 3 independent experiments is shown. (B, E-H) The results are shown as the mean ± SEM of 3 independent experiments (n = 3). P values were generated by one-way ANOVA, followed by a Tukey-Kramer multiple comparison test; *p < 0.05; **p < 0.01; ***p < 0.001.
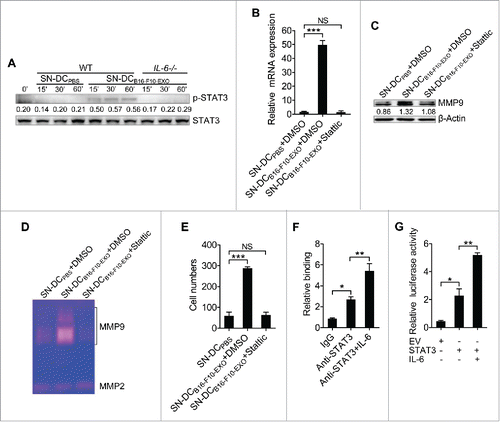
Figure 3. Activation of STAT3 by IL-6 from Ta-DCs increased transcription of MMP9. (A, B) B16-F10 cells were cultured in supernatant from PBS-stimulated BMDCs of WT mice or B16-F10-EXO (5 μg/ml for 6 h)-stimulated BMDCs of WT or IL-6−/− mice for the indicated time points. Then, the p-STAT3 and STAT3 protein levels were detected by Western blot (A), or with or without 2 μM of Stattic for 6 h. Then, the MMP9 mRNA level was detected by real-time PCR (B). (C-E) B16-F10 cells were cultured in supernatant from PBS- or B16-F10-EXO (5 μg/ml for 6 h)-stimulated BMDCs with or without 2 μM of Stattic for 24 h. Then, the MMP9 protein level was detected by Western blot (C), or the cells were collected and cultured in serum-free DMEM media for another 24 h. The MMP2 and MMP9 activity in the supernatant was detected by gelatin zymography (D), or the invasive ability of B16-F10 cells was measured using an in vitro invasive assay (n = 5) (E). (F) B16-F10 cells were stimulated with or without 10 ng/ml of IL-6 for 24 h, and the binding of STAT3 and the MMP9 promoter was examined by ChIP assay. (G) NIH-3T3 cells were transfected with MMP9-luc, along with STAT3 plasmids, with or without 10 ng/ml of IL-6 stimulation. Twenty-four hours later, luciferase activity was analyzed and normalized to that of Renilla luciferase. (A, C) Numbers indicate the ratio of gray values of the corresponding protein to that of STAT3 or β-Actin. (A, C, D) One representative of 3 independent experiments is shown. (B, E-H) The results are shown as the mean ± SEM of 3 independent experiments (n = 3). P values were generated by one-way ANOVA, followed by a Tukey-Kramer multiple comparison test; *p < 0.05; **p < 0.01; ***p < 0.001.

Figure 4. HSP72 and HSP105 on the surface of TEXs mediated TLR2- and TLR4-dependent IL-6 secretion of DCs. (A) BMDCs were pre-incubated with anti-TLR2, TLR4 or both mAbs at a concentration of 30 μg/ml for 1 h, and BMDCs were stimulated with 5 μg/ml B16-F10-EXO for 6 h. IL-6 production from BMDCs was measured by ELISA. (B, C) Exosomes from B16-F10 cells transfected with HSP72, HSP105 or HSC70 siRNA, or NC siRNA were isolated. The HSP protein knockdown effect was detected by Western blot (B). BMDCs were stimulated with 5 μg/ml of the indicated B16-F10-EXO for 6 h, and IL-6 production from BMDCs was measured by ELISA (C). (D, E) After adsorption onto latex beads (D) or anti-CD63-coated latex beads (E), HSP72 and HSP105 on exosomes were detected by flow cytometry. (F, G) BMDCs were pretreated with 2.5 μg/ml cytochalasin D for 30 min, and co-cultured with CFSE-labeled B16-F10-EXO for 6 h. The uptake of B16-F10-EXO by BMDCs was detected by confocal microscopy (F), or stimulated with B16-F10-EXO for 6 h. IL-6 production by BMDCs was measured by ELISA (G). (B) Numbers indicate the ratio of gray values of the corresponding protein to that of CD63. (A, C, G) The results are shown as the mean ± SEM of 3 independent experiments (n = 3). (B, D, E, F) One representative of 3 independent experiments is shown. P values were generated by one-way ANOVA, followed by a Tukey-Kramer multiple comparison test; *p < 0.05 and ***p< 0.001 versus B16-F10-EXO in A.
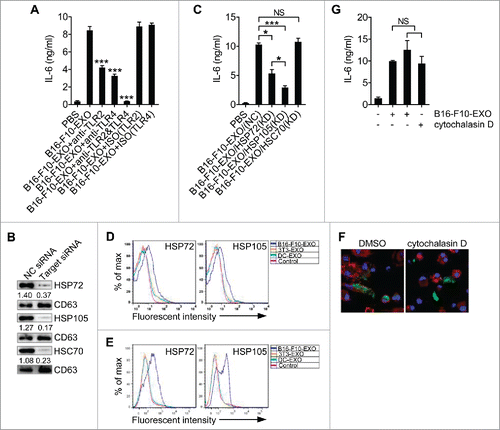
Figure 4. HSP72 and HSP105 on the surface of TEXs mediated TLR2- and TLR4-dependent IL-6 secretion of DCs. (A) BMDCs were pre-incubated with anti-TLR2, TLR4 or both mAbs at a concentration of 30 μg/ml for 1 h, and BMDCs were stimulated with 5 μg/ml B16-F10-EXO for 6 h. IL-6 production from BMDCs was measured by ELISA. (B, C) Exosomes from B16-F10 cells transfected with HSP72, HSP105 or HSC70 siRNA, or NC siRNA were isolated. The HSP protein knockdown effect was detected by Western blot (B). BMDCs were stimulated with 5 μg/ml of the indicated B16-F10-EXO for 6 h, and IL-6 production from BMDCs was measured by ELISA (C). (D, E) After adsorption onto latex beads (D) or anti-CD63-coated latex beads (E), HSP72 and HSP105 on exosomes were detected by flow cytometry. (F, G) BMDCs were pretreated with 2.5 μg/ml cytochalasin D for 30 min, and co-cultured with CFSE-labeled B16-F10-EXO for 6 h. The uptake of B16-F10-EXO by BMDCs was detected by confocal microscopy (F), or stimulated with B16-F10-EXO for 6 h. IL-6 production by BMDCs was measured by ELISA (G). (B) Numbers indicate the ratio of gray values of the corresponding protein to that of CD63. (A, C, G) The results are shown as the mean ± SEM of 3 independent experiments (n = 3). (B, D, E, F) One representative of 3 independent experiments is shown. P values were generated by one-way ANOVA, followed by a Tukey-Kramer multiple comparison test; *p < 0.05 and ***p< 0.001 versus B16-F10-EXO in A.

Figure 5. HSP105 acts as a ligand of TLR2 and TLR4 to induce DC IL-6 production. (A) Affinity precipitation of recombinant His-TLR2 or His-TLR4 protein with Flag-EGFP or Flag-HSP105 protein, captured by anti-FLAG® M2 magnetic beads and analyzed by immunoblot analysis with Abs against TLR2 and TLR4. (B) BMDCs were pre-incubated with anti-TLR2, TLR4 or both mAbs at a concentration of 30 μg/ml for 1 h, and then stimulated with 2 μg/ml endotoxin-free Flag-EGFP or Flag-HSP105 protein for 6 h. IL-6 production was measured by ELISA (n = 3). (A) One representative of 3 independent experiments is shown. (B) The results are shown as the mean ± SEM of 3 independent experiments. P values were generated by one-way ANOVA, followed by a Tukey-Kramer multiple comparison test; *p < 0.05; **p < 0.01; ***p < 0.001.
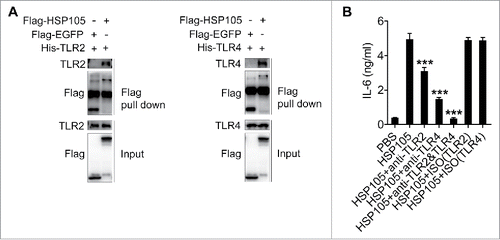
Figure 5. HSP105 acts as a ligand of TLR2 and TLR4 to induce DC IL-6 production. (A) Affinity precipitation of recombinant His-TLR2 or His-TLR4 protein with Flag-EGFP or Flag-HSP105 protein, captured by anti-FLAG® M2 magnetic beads and analyzed by immunoblot analysis with Abs against TLR2 and TLR4. (B) BMDCs were pre-incubated with anti-TLR2, TLR4 or both mAbs at a concentration of 30 μg/ml for 1 h, and then stimulated with 2 μg/ml endotoxin-free Flag-EGFP or Flag-HSP105 protein for 6 h. IL-6 production was measured by ELISA (n = 3). (A) One representative of 3 independent experiments is shown. (B) The results are shown as the mean ± SEM of 3 independent experiments. P values were generated by one-way ANOVA, followed by a Tukey-Kramer multiple comparison test; *p < 0.05; **p < 0.01; ***p < 0.001.

Figure 6. Exosomes from tumor patients with increased membrane-associated HSP72 and HSP105 induced DCs to promote tumor cell invasion via IL-6 in vitro. (A) After adsorption onto latex beads, HSP72 and HSP105 on EXO-PT and EXO-TT were detected by flow cytometry. RFI was calculated by dividing mean fluorescence intensity of samples staining with detection Abs by that of sample staining with ISO Abs (n = 7). (B) Human DCs were induced from PBMCs and stimulated with 5 μg/ml of EXO-PT or EXO-TT from breast tumor tissues for 6 h. The IL-6 production was measured by ELISA (n = 3). (C) MDA-MB-435S cells were cultured in supernatant from PBS-, EXO-PT- or EXO-TT (5 μg/ml for 6 h)-stimulated DCs with or without 30 μg/ml of anti-IL-6 or ISO mAbs for 24 h. Then, their invasive ability was measured using an in vitro invasive assay, and the cells on the bottom of the Transwell filter were imaged and quantified (Magnification: 200 ×). (D) The results of (C) were statistically analyzed (n = 5). (E, F) After adsorption onto latex beads, HSP72 and HSP105 on exosomes from sera of breast tumor patients or healthy controls were detected by flow cytometry. One representative result of 12 is shown (E). RFI was calculated and statistically analyzed (F). (B, D) The results are shown as the mean ± SEM of 3 independent experiments. (C) One representative of 3 independent experiments is shown. P values were generated by 2-tail student's t-test in A, F, and by one-way ANOVA, followed by a Tukey-Kramer multiple comparison test in B, D; ***p < 0.001.
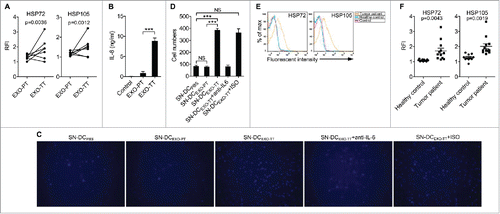
Figure 6. Exosomes from tumor patients with increased membrane-associated HSP72 and HSP105 induced DCs to promote tumor cell invasion via IL-6 in vitro. (A) After adsorption onto latex beads, HSP72 and HSP105 on EXO-PT and EXO-TT were detected by flow cytometry. RFI was calculated by dividing mean fluorescence intensity of samples staining with detection Abs by that of sample staining with ISO Abs (n = 7). (B) Human DCs were induced from PBMCs and stimulated with 5 μg/ml of EXO-PT or EXO-TT from breast tumor tissues for 6 h. The IL-6 production was measured by ELISA (n = 3). (C) MDA-MB-435S cells were cultured in supernatant from PBS-, EXO-PT- or EXO-TT (5 μg/ml for 6 h)-stimulated DCs with or without 30 μg/ml of anti-IL-6 or ISO mAbs for 24 h. Then, their invasive ability was measured using an in vitro invasive assay, and the cells on the bottom of the Transwell filter were imaged and quantified (Magnification: 200 ×). (D) The results of (C) were statistically analyzed (n = 5). (E, F) After adsorption onto latex beads, HSP72 and HSP105 on exosomes from sera of breast tumor patients or healthy controls were detected by flow cytometry. One representative result of 12 is shown (E). RFI was calculated and statistically analyzed (F). (B, D) The results are shown as the mean ± SEM of 3 independent experiments. (C) One representative of 3 independent experiments is shown. P values were generated by 2-tail student's t-test in A, F, and by one-way ANOVA, followed by a Tukey-Kramer multiple comparison test in B, D; ***p < 0.001.

Figure 7. HSP72 and HSP105 mediated Ta-DCs promotion of B16-F10 tumor lung metastasis via an IL-6/MMP9 pathway in vivo. (A, B) B16-F10 cells were cultured in supernatant from PBS-stimulated BMDCs of WT mice, or B16-F10-EXO (5 μg/ml for 6 h)-stimulated BMDCs of WT or IL-6−/− mice for 24 h. Then, 5 × 105 tumor cells were intravenously injected into mice, and these mice were killed 15 d later. Representative gross morphology of the lungs is shown (A). Numbers of invasive nodules in the lungs were counted and statistically analyzed (B). (C) The MMP9 protein level in B16-F10-MMP9(KD cells was detected by Western blot. (D, E) B16-F10-MMP9(KD) cells were cultured in supernatant from B16-F10-EXO (5 μg/ml for 6 h)-stimulated BMDCs for 24 h. Then, 5 × 105 tumor cells were intravenously injected into mice, and these mice were killed 15 d later. Representative gross morphology of the lungs is shown (D). Numbers of invasive nodules in the lungs were counted and statistically analyzed (E). (F, G) B16-F10 cells were cultured in supernatant from B16-F10-EXO/(EV)-, B16-F10-EXO/HSP72(OE)- or B16-F10-EXO/HSP105(OE) (5 μg/ml for 6 h)-stimulated BMDCs for 24 h. Then, 5 × 105 tumor cells were intravenously injected into mice, and these mice were killed 15 d later. Representative gross morphology of the lungs is shown (F). Numbers of invasive nodules in the lungs were counted and statistically analyzed (G). (C) Numbers indicate the ratio of gray values of MMP9 to that of β-Actin. (A, C, D, F) One representative of 3 independent experiments is shown. (B, E, G) The results are shown as the mean ± SEM of 3 independent experiments (n = 5). P values were generated by one-way ANOVA, followed by a Tukey-Kramer multiple comparison test; **p < 0.01; ***p < 0.001. Control indicates B16-F10 cells without any treatment.
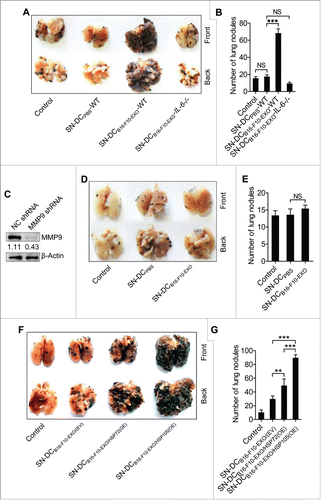
Figure 7. HSP72 and HSP105 mediated Ta-DCs promotion of B16-F10 tumor lung metastasis via an IL-6/MMP9 pathway in vivo. (A, B) B16-F10 cells were cultured in supernatant from PBS-stimulated BMDCs of WT mice, or B16-F10-EXO (5 μg/ml for 6 h)-stimulated BMDCs of WT or IL-6−/− mice for 24 h. Then, 5 × 105 tumor cells were intravenously injected into mice, and these mice were killed 15 d later. Representative gross morphology of the lungs is shown (A). Numbers of invasive nodules in the lungs were counted and statistically analyzed (B). (C) The MMP9 protein level in B16-F10-MMP9(KD cells was detected by Western blot. (D, E) B16-F10-MMP9(KD) cells were cultured in supernatant from B16-F10-EXO (5 μg/ml for 6 h)-stimulated BMDCs for 24 h. Then, 5 × 105 tumor cells were intravenously injected into mice, and these mice were killed 15 d later. Representative gross morphology of the lungs is shown (D). Numbers of invasive nodules in the lungs were counted and statistically analyzed (E). (F, G) B16-F10 cells were cultured in supernatant from B16-F10-EXO/(EV)-, B16-F10-EXO/HSP72(OE)- or B16-F10-EXO/HSP105(OE) (5 μg/ml for 6 h)-stimulated BMDCs for 24 h. Then, 5 × 105 tumor cells were intravenously injected into mice, and these mice were killed 15 d later. Representative gross morphology of the lungs is shown (F). Numbers of invasive nodules in the lungs were counted and statistically analyzed (G). (C) Numbers indicate the ratio of gray values of MMP9 to that of β-Actin. (A, C, D, F) One representative of 3 independent experiments is shown. (B, E, G) The results are shown as the mean ± SEM of 3 independent experiments (n = 5). P values were generated by one-way ANOVA, followed by a Tukey-Kramer multiple comparison test; **p < 0.01; ***p < 0.001. Control indicates B16-F10 cells without any treatment.

Figure 8. Depletion of IL-6 signaling converted TEXs from promoters to inhibitors of tumor metastasis in vivo. (A, B) Mice were intravenously injected with 100 μl of PBS or 10 μg/100 μl of B16-F10-EXO labeled with or without PKH26 and killed 24 h later. Then, DCs and nuclei in the sections of spleens were stained with CD11c and DAPI, respectively. The binding of DCs and B16-F10-EXO was detected with an immunofluorescence assay. Arrows indicate the binding (A). DCs in splenocytes were isolated. The expression of MHC-II, CD80, CD86 and CD40 molecules on DCs were detected by flow cytometry (B). (C, D, E) Mice with an intravenous injection of 5 × 105 B16-F10 or B16-F10/OVA cells on day 0, were intravenously injected with 100 μl of PBS, 10 μg/100 μl of B16-F10-EXO or B16-F10/OVA-EXO on days 4, 7 and 10. Mice were killed and numbers of invasive nodules in the lungs were counted and statistically analyzed on day 15 (n = 5) (C). The OVA257–264 peptide specific CD8+ T cells in the lungs were detected by Tetramer assay (D). Data in (D) were statistically analyzed (n = 3) (E). (A, B, D) One representative of 3 (A, B) or 2 (D) independent experiments is shown. (C, E) The results are shown as the mean ± SEM of 3 independent experiments. P values were generated by a 2-tail student's t-test.
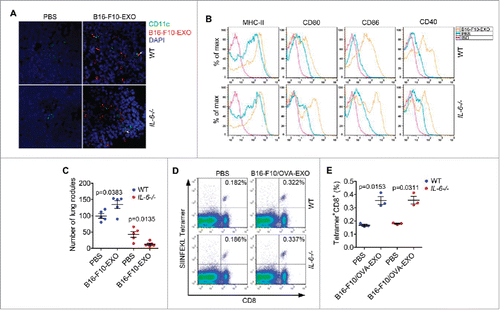
Figure 8. Depletion of IL-6 signaling converted TEXs from promoters to inhibitors of tumor metastasis in vivo. (A, B) Mice were intravenously injected with 100 μl of PBS or 10 μg/100 μl of B16-F10-EXO labeled with or without PKH26 and killed 24 h later. Then, DCs and nuclei in the sections of spleens were stained with CD11c and DAPI, respectively. The binding of DCs and B16-F10-EXO was detected with an immunofluorescence assay. Arrows indicate the binding (A). DCs in splenocytes were isolated. The expression of MHC-II, CD80, CD86 and CD40 molecules on DCs were detected by flow cytometry (B). (C, D, E) Mice with an intravenous injection of 5 × 105 B16-F10 or B16-F10/OVA cells on day 0, were intravenously injected with 100 μl of PBS, 10 μg/100 μl of B16-F10-EXO or B16-F10/OVA-EXO on days 4, 7 and 10. Mice were killed and numbers of invasive nodules in the lungs were counted and statistically analyzed on day 15 (n = 5) (C). The OVA257–264 peptide specific CD8+ T cells in the lungs were detected by Tetramer assay (D). Data in (D) were statistically analyzed (n = 3) (E). (A, B, D) One representative of 3 (A, B) or 2 (D) independent experiments is shown. (C, E) The results are shown as the mean ± SEM of 3 independent experiments. P values were generated by a 2-tail student's t-test.

Figure 9. DCs with enhanced IL-6-secretion capacity were found in tumor-bearing mice and patients. (A, B) Mice were subcutaneously inoculated with 5 × 105 B16-F10 cells, and mice without tumor inoculation were used as controls. Then, DCs from splenocytes were isolated 1 week, 2 weeks or 3 weeks later and stimulated with PBS, 5 μg/ml B16-F10-EXO or 100 ng/ml of LPS for 6 h. IL-6 production by DCs was detected by ELISA (n = 3) (A). DCs from splenocytes were isolated 3 weeks later and cultured in vitro for 6 h. Culture supernatant was collected and B16-F10 cells were cultured in this supernatant for 24 h. Then, the invasive ability of B16-F10 cells was measured (n = 5). Control indicates B16-F10 cells without any treatment (B). SN-DCPBS or SN-DCtumor denotes supernatant from DCs of healthy control mice or tumor mice, respectively. (C) Mice were intravenously injected with 100 μl of PBS or 10 μg/100 μl of B16-F10-EXO. Then, DCs from splenocytes were isolated 12 or 24 h later and cultured in vitro for 6 h. IL-6 production by DCs was detected by ELISA (n = 3). (D) Human DCs were isolated from PBMCs from healthy volunteers (n = 27) or breast tumor patients (n = 18) and cultured in vitro for 6 h with or without 100 ng/ml LPS. IL-6 production by DCs was detected by ELISA. The results are shown as the mean ± SEM of 3 independent experiments or of all detected samples. P values were generated by a 2-tail student's t-test.
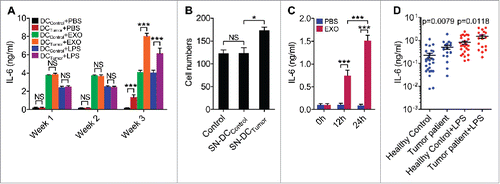
Figure 9. DCs with enhanced IL-6-secretion capacity were found in tumor-bearing mice and patients. (A, B) Mice were subcutaneously inoculated with 5 × 105 B16-F10 cells, and mice without tumor inoculation were used as controls. Then, DCs from splenocytes were isolated 1 week, 2 weeks or 3 weeks later and stimulated with PBS, 5 μg/ml B16-F10-EXO or 100 ng/ml of LPS for 6 h. IL-6 production by DCs was detected by ELISA (n = 3) (A). DCs from splenocytes were isolated 3 weeks later and cultured in vitro for 6 h. Culture supernatant was collected and B16-F10 cells were cultured in this supernatant for 24 h. Then, the invasive ability of B16-F10 cells was measured (n = 5). Control indicates B16-F10 cells without any treatment (B). SN-DCPBS or SN-DCtumor denotes supernatant from DCs of healthy control mice or tumor mice, respectively. (C) Mice were intravenously injected with 100 μl of PBS or 10 μg/100 μl of B16-F10-EXO. Then, DCs from splenocytes were isolated 12 or 24 h later and cultured in vitro for 6 h. IL-6 production by DCs was detected by ELISA (n = 3). (D) Human DCs were isolated from PBMCs from healthy volunteers (n = 27) or breast tumor patients (n = 18) and cultured in vitro for 6 h with or without 100 ng/ml LPS. IL-6 production by DCs was detected by ELISA. The results are shown as the mean ± SEM of 3 independent experiments or of all detected samples. P values were generated by a 2-tail student's t-test.
Supplemental material

2017ONCOIMM0332R-s02.docx

Download MS Word (1.9 MB)

Reprints and Corporate Permissions

Please note: Selecting permissions does not provide access to the full text of the article, please see our help page How do I view content?

To request a reprint or corporate permissions for this article, please click on the relevant link below:

Academic Permissions

Please note: Selecting permissions does not provide access to the full text of the article, please see our help page How do I view content?

Obtain permissions instantly via Rightslink by clicking on the button below:

If you are unable to obtain permissions via Rightslink, please complete and submit this Permissions form. For more information, please visit our Permissions help page.