1,616
Views
13
CrossRef citations to date
0
Altmetric
Original Research

Phenotype and tissue distribution of CD28H+ immune cell subsets

, , , , &
Article: e1362529 | Received 25 May 2017, Accepted 26 Jul 2017, Published online: 11 Sep 2017

Figures & data

Figure 1. CD28H is expressed on immune cell subsets in healthy human peripheral blood. (A) Representative flow cytometric plots showing staining against CD28H or isotype control on FSC/SSCSINGLETSCD45+CD3CD19 granulocytes (CD33+CD14CD15+), monocytes (CD33+CD14CD15+), myeloid dendritic cells (MDCs) (CD33+CD14CD15CD11 c+HLA-DR+) and plasmacytoid cells (PDCs) (CD33HLA-DR+CD123+). (B) Representative flow cytometric plots showing staining against CD28H or isotype control on FSC/SSCLOWCD45+CD3 B cells (CD19+), NK cells (CD7+CD19CD16+NKp46+), innate lymphoid cells (ILCs) (linCD7+CD19CD16CD127+), and FSC/SSCLOWCD45+CD19 T cells (CD3+). (C) Bar graphs summarize CD28H expression from (A) and (B). (D) Representative flow cytometric plots showing staining against CD28H or isotype control on FSC/SSCLOWCD45+CD33CD19CD3+ naïve (CD45RA+CD45ROCCR7+CD62 L+) and memory (CD45RACD45RO+ CCR7CD62 L) CD4+ and CD8+ T cells. (E) Bar graphs summarize CD28H expression from (D). *, P < 0.05. 6–10 donors.
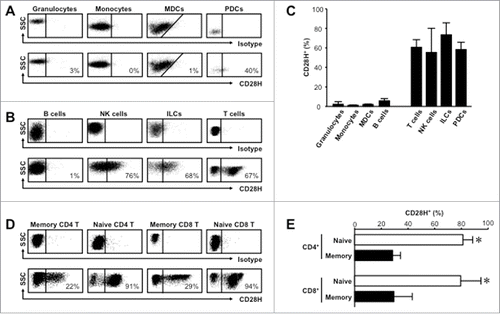
Figure 1. CD28H is expressed on immune cell subsets in healthy human peripheral blood. (A) Representative flow cytometric plots showing staining against CD28H or isotype control on FSC/SSCSINGLETSCD45+CD3−CD19− granulocytes (CD33+CD14−CD15+), monocytes (CD33+CD14−CD15+), myeloid dendritic cells (MDCs) (CD33+CD14−CD15−CD11 c+HLA-DR+) and plasmacytoid cells (PDCs) (CD33−HLA-DR+CD123+). (B) Representative flow cytometric plots showing staining against CD28H or isotype control on FSC/SSCLOWCD45+CD3− B cells (CD19+), NK cells (CD7+CD19−CD16+NKp46+), innate lymphoid cells (ILCs) (lin−CD7+CD19−CD16−CD127+), and FSC/SSCLOWCD45+CD19− T cells (CD3+). (C) Bar graphs summarize CD28H expression from (A) and (B). (D) Representative flow cytometric plots showing staining against CD28H or isotype control on FSC/SSCLOWCD45+CD33−CD19−CD3+ naïve (CD45RA+CD45RO−CCR7+CD62 L+) and memory (CD45RA−CD45RO+ CCR7−CD62 L−) CD4+ and CD8+ T cells. (E) Bar graphs summarize CD28H expression from (D). *, P < 0.05. 6–10 donors.

Figure 2. CD28H+ naïve T cells show increased naïve characteristics. (A) Expression of CD31 on naïve T cells. Representative plots and the mean percentages + SEM showing CD31 expression on CD28H+ and CD28H naïve T cells. (B) Expression of T-bet on naïve T cells. Representative plots and the mean percentages + SEM showing T-bet expression on CD28H+ and CD28H naïve T cells. (C) Expression of IFNγ on naïve T cells. Representative plots and the mean percentages + SEM showing IFNγ expression on CD28H+ and CD28H naïve T cells. (D) Expression of TNFα on naïve T cells. Representative plots and the mean percentages + SEM showing TNFα expression on CD28H+ and CD28H naïve T cells. (E) Expression of CD28 on naïve T cells. Representative plots and the mean percentages + SEM showing CD28 expression on CD28H+ and CD28H naïve T cells. 6–8 donors, *, P < 0.05. (F) Kinetic CD28H expression in in vitro cultured enriched naïve T cells. Enriched peripheral blood CD4+ naïve T cells were stimulated with anti-CD3 and anti-CD28 every 3 d for up to 20 d as described. CD28H surface expression was measured by FACS. 3 donors with repeats.
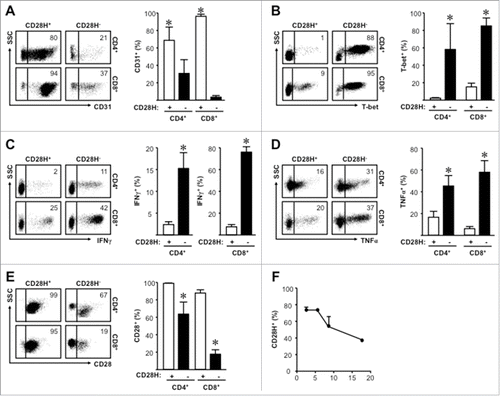
Figure 2. CD28H+ naïve T cells show increased naïve characteristics. (A) Expression of CD31 on naïve T cells. Representative plots and the mean percentages + SEM showing CD31 expression on CD28H+ and CD28H− naïve T cells. (B) Expression of T-bet on naïve T cells. Representative plots and the mean percentages + SEM showing T-bet expression on CD28H+ and CD28H− naïve T cells. (C) Expression of IFNγ on naïve T cells. Representative plots and the mean percentages + SEM showing IFNγ expression on CD28H+ and CD28H− naïve T cells. (D) Expression of TNFα on naïve T cells. Representative plots and the mean percentages + SEM showing TNFα expression on CD28H+ and CD28H− naïve T cells. (E) Expression of CD28 on naïve T cells. Representative plots and the mean percentages + SEM showing CD28 expression on CD28H+ and CD28H− naïve T cells. 6–8 donors, *, P < 0.05. (F) Kinetic CD28H expression in in vitro cultured enriched naïve T cells. Enriched peripheral blood CD4+ naïve T cells were stimulated with anti-CD3 and anti-CD28 every 3 d for up to 20 d as described. CD28H surface expression was measured by FACS. 3 donors with repeats.

Figure 3. CD28H+ memory T cells show less effector function marks. (A, B) Expression of IFNγ on memory T cells. Representative plots and the mean percentages + SEM showing IFNγ expression on CD28H+ and CD28H memory T cells. (C, D) Expression of CD57 on memory T cells. Representative plots and the mean percentages + SEM showing CD57 expression on CD28H+ and CD28H memory T cells. 6–8 donors, *, P < 0.05.

Figure 3. CD28H+ memory T cells show less effector function marks. (A, B) Expression of IFNγ on memory T cells. Representative plots and the mean percentages + SEM showing IFNγ expression on CD28H+ and CD28H− memory T cells. (C, D) Expression of CD57 on memory T cells. Representative plots and the mean percentages + SEM showing CD57 expression on CD28H+ and CD28H− memory T cells. 6–8 donors, *, P < 0.05.

Figure 4. CD28H expression on tissue T cell subsets. (A, B) Representative flow cytometric plots for isotype and anti-CD28H staining (A) and the percentages + SEM of CD28H expression (D) on secondary lymphoid tissue T cells. 4–6 donors. (C, D) Representative flow cytometric plots for isotype and anti-CD28H staining (C) and the percentages + SEM of CD28H expression (D) on pathological tissue T cells. 4–6 donors. (E, F) The mean percentages + SEM of CD57 (E) and IFNγ (F) expressing CD8+ T cells in CD28H+ and CD28H subsets from pathological tissue T cells. 4–6 donors, *, P < 0.05. OCB, blood from ovarian cancer patient; Ca, Cancer.
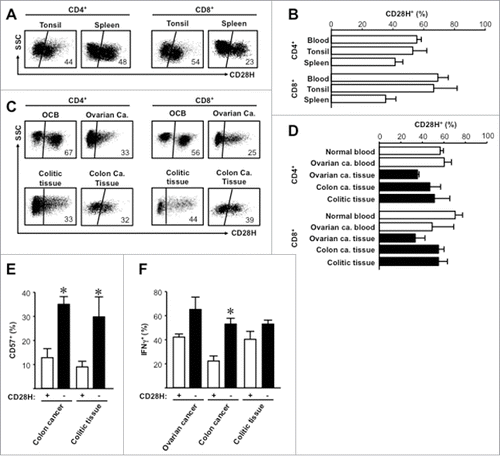
Figure 4. CD28H expression on tissue T cell subsets. (A, B) Representative flow cytometric plots for isotype and anti-CD28H staining (A) and the percentages + SEM of CD28H expression (D) on secondary lymphoid tissue T cells. 4–6 donors. (C, D) Representative flow cytometric plots for isotype and anti-CD28H staining (C) and the percentages + SEM of CD28H expression (D) on pathological tissue T cells. 4–6 donors. (E, F) The mean percentages + SEM of CD57 (E) and IFNγ (F) expressing CD8+ T cells in CD28H+ and CD28H− subsets from pathological tissue T cells. 4–6 donors, *, P < 0.05. OCB, blood from ovarian cancer patient; Ca, Cancer.

Figure 5. CD28H expression on NK cells and ILCs. (A-C) NK cells were gated on CD45+CD3CD7+CD16+CD19CD33CD34CD127. (A) Representative flow cytometric plots for isotype and anti-CD28H staining in NK cells. (B) The mean percentage + SEM of CD28H positive cells in NK cells in peripheral blood of healthy donors (n = 8), tonsil (n = 5) and spleen (n = 4). (C) The mean percentage + SEM of CD28H positive cells in NK cells in ovarian cancer patient blood (n = 5) and cancer tissues from patients with ovarian cancer (n = 5), colon cancer (n = 5), and lung cancer (n = 4). *, P < 0.05. (D-F) ILCs were gated on CD45+ CD3 CD7+ CD16 CD19 CD33 CD34 CD127+. (D) Representative flow cytometric plots of ILCs in secondary lymphoid organs and cancer tissues for isotype and anti-CD28H staining. (E) The mean percentage + SEM of CD28H positive cells in ILCs in peripheral blood of healthy donors (n = 8), tonsil (n = 5) and spleen (n = 4). (F) The mean percentage + SEM of CD28H positive cells in ILCs in ovarian cancer patient blood (n = 5) and cancer tissues from patients with ovarian cancer (n = 5), colon cancer (n = 5), lung cancer (n = 4), and breast cancer (n = 3).
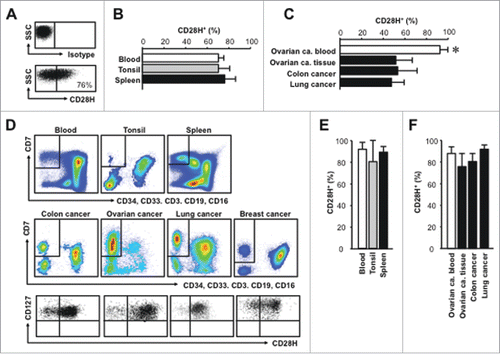
Figure 5. CD28H expression on NK cells and ILCs. (A-C) NK cells were gated on CD45+CD3−CD7+CD16+CD19−CD33−CD34−CD127−. (A) Representative flow cytometric plots for isotype and anti-CD28H staining in NK cells. (B) The mean percentage + SEM of CD28H positive cells in NK cells in peripheral blood of healthy donors (n = 8), tonsil (n = 5) and spleen (n = 4). (C) The mean percentage + SEM of CD28H positive cells in NK cells in ovarian cancer patient blood (n = 5) and cancer tissues from patients with ovarian cancer (n = 5), colon cancer (n = 5), and lung cancer (n = 4). *, P < 0.05. (D-F) ILCs were gated on CD45+ CD3− CD7+ CD16− CD19− CD33− CD34− CD127+. (D) Representative flow cytometric plots of ILCs in secondary lymphoid organs and cancer tissues for isotype and anti-CD28H staining. (E) The mean percentage + SEM of CD28H positive cells in ILCs in peripheral blood of healthy donors (n = 8), tonsil (n = 5) and spleen (n = 4). (F) The mean percentage + SEM of CD28H positive cells in ILCs in ovarian cancer patient blood (n = 5) and cancer tissues from patients with ovarian cancer (n = 5), colon cancer (n = 5), lung cancer (n = 4), and breast cancer (n = 3).
Supplemental material

Reprints and Corporate Permissions

Please note: Selecting permissions does not provide access to the full text of the article, please see our help page How do I view content?

To request a reprint or corporate permissions for this article, please click on the relevant link below:

Academic Permissions

Please note: Selecting permissions does not provide access to the full text of the article, please see our help page How do I view content?

Obtain permissions instantly via Rightslink by clicking on the button below:

If you are unable to obtain permissions via Rightslink, please complete and submit this Permissions form. For more information, please visit our Permissions help page.