Figures & data
Figure 1. Overexpression of NmU correlates with increased TGFβ1 and PD-L1 levels. (A), (B), and (C), TGFβ1 levels were determined by ELISA in serum-free conditioned medium of HCC1954 and SKBR3 cell variants and expressed as pg TGFβ1 per mg total cell protein. (D) and F, HCC1954 cell variants were stained with APC-labeled anti-PD-L1, followed by FACS analysis in a FACSCanto II flow cytometer. (E) and (G), Same as in (D) for SKBR3 cell variants. Results represent averaged replicates from at least 3 independent experiments. *p < 0.05, **p < 0.01, ***p < 0.001.
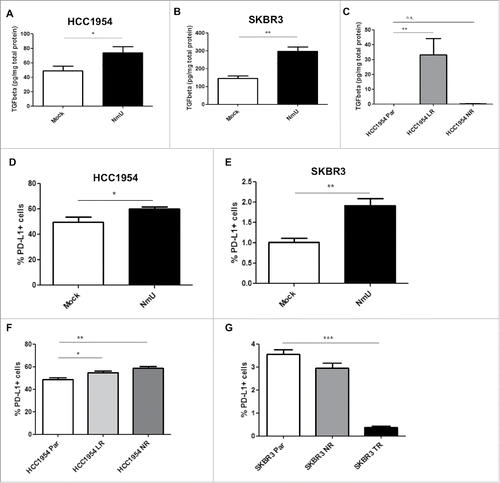
Figure 2. Overexpression of NmU confers resistance to ADCC. Cells (A) and (C), HCC1954 cells, (B) and (D), SKBR3 cells) were seeded in a round bottom 96-well plate and incubated with trastuzumab (100µg/ml). PBMCs were isolated from healthy donor blood by Ficoll gradient centrifugation and added on top of cells at the appropriate ratios. Cells were incubated at 37°C for a further 6h and cell lysis was then assessed by LDH release. (B) and (D), Same as in (A), but for SKBR3 cell variants. Averaged results from technical triplicates from at least 2 independent experiments with PBMCs from different donors are shown. *p < 0.05, **p < 0.01, ***p < 0.001. [Note The 100% of cell lysis is calculated based on cancer cells alone and so sometimes the percentage of cell lysis following addition of PBMCs can be over 100% as some PBMCs also die and release their LDH content into the medium].
![Figure 2. Overexpression of NmU confers resistance to ADCC. Cells (A) and (C), HCC1954 cells, (B) and (D), SKBR3 cells) were seeded in a round bottom 96-well plate and incubated with trastuzumab (100µg/ml). PBMCs were isolated from healthy donor blood by Ficoll gradient centrifugation and added on top of cells at the appropriate ratios. Cells were incubated at 37°C for a further 6h and cell lysis was then assessed by LDH release. (B) and (D), Same as in (A), but for SKBR3 cell variants. Averaged results from technical triplicates from at least 2 independent experiments with PBMCs from different donors are shown. *p < 0.05, **p < 0.01, ***p < 0.001. [Note The 100% of cell lysis is calculated based on cancer cells alone and so sometimes the percentage of cell lysis following addition of PBMCs can be over 100% as some PBMCs also die and release their LDH content into the medium].](/cms/asset/94b6e65b-07bb-493b-9c97-4c699706281a/koni_a_1362530_f0002_b.gif)
Figure 3. EVs from NmU-overexpressing and HER2-targeted drug-resistant variants show altered content of TGFβ1 and PD-L1. (A), (C), and €, TGFβ1 levels were determined by ELISA in intact (unlysed) EVs from HCC1954 (A), EFM192A (C) and SKBR3 (E) cell variants and expressed as pg TGFβ1 per mg total EV protein. B, D, and F, PD-L1 levels were determined by ELISA in EVs from HCC1954 (B), EFM192A (D) and SKBR3 (F) cell variants and expressed as pg PD-L1 per mg total EV protein. Results represent averaged replicates of at least 3 independent experiments. *p < 0.05, **p < 0.01, ***p < 0.001.
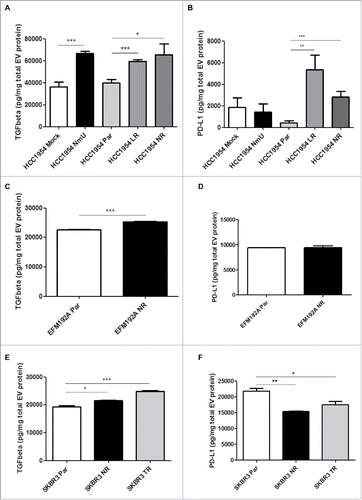
Figure 4. Treatment with EVs from NmU-overexpressing and HER2-targeted drug-resistant variants enhances TGFβ1 secretion. (A) and (B), HCC1954 Par cells were treated with EVs from different HCC1954 cell variants (20 µg EV/1 × 105 cells) for 48 hr. Cell conditioned medium was then analyzed for TGFβ1 content by ELISA, expressed as pg TGFβ1 per mg total cell protein. (C), Same as in (A) for EFM192A cells. (D), Same as in (A) for SKBR3 cells. Results represent averaged replicates of at least 3 independent experiments. **p < 0.01, ***p < 0.001.
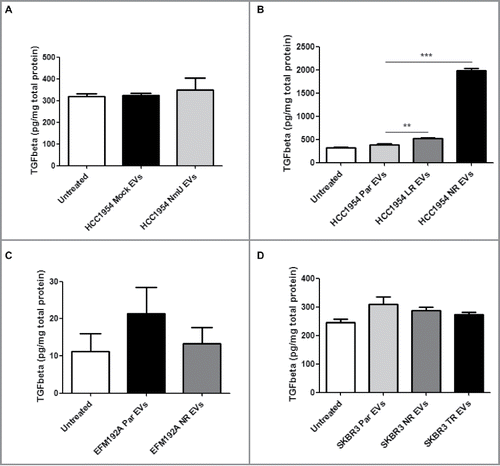
Figure 5. Treatment with EVs from NmU-overexpressing and HER2-targeted drug-resistant variants increases PD-L1 expression. (A) and (B), HCC1954 Par cells were treated with EVs from different HCC1954 cell variants (20 µg EV/1 × 105 cells) for 48 hr. PD-L1 surface staining was then analyzed by flow cytometry. (C), Same as in A for EFM192A cells. (D), Same as in (A) for SKBR3 cells. Results represent averaged replicates of at least 3 independent experiments and are expressed as fold difference with respect to cells treated with EVs from parent cell variants, which is considered to be equal to 1. *p < 0.05.
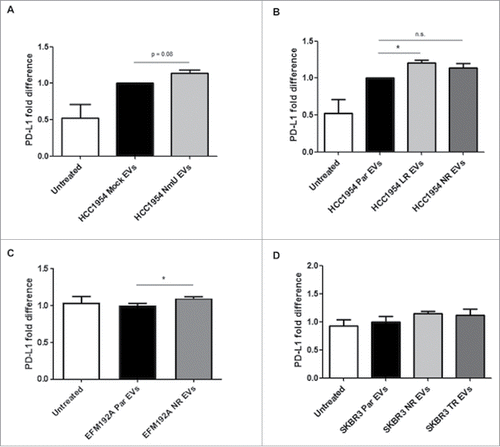
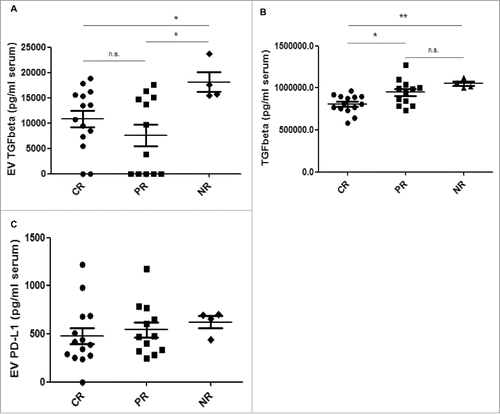
Figure 6. EV TGFβ1 levels correlate with response to HER2-targeted therapy in HER2-overexpressing breast cancer patients. EVs were isolated from 250 µl patients' sera by serial ultracentrifugation. (A), TGFβ1 was detected on intact EVs isolated from patient serum by ELISA. Values are expressed as pg TGFβ1 per ml of serum. (B), TGFβ1 was detected in patients' sera by ELISA. Values are expressed as pg TGFβ1 per ml of serum. C, PD-L1 was detected on intact EVs by ELISA. Values are expressed as pg PD-L1 per mg total EV protein. *p ≤ 0.05, **p < 0.01.
