2,415
Views
40
CrossRef citations to date
0
Altmetric
Original Research

CAR T-cell immunotherapy of MET-expressing malignant mesothelioma

, ORCID Icon, , , , , , , , , , , & show all
Article: e1363137 | Received 10 Apr 2017, Accepted 31 Jul 2017, Published online: 25 Aug 2017

Figures & data

Figure 1. Histology, MET receptor expression and survival analysis of patients with malignant pleural mesothelioma. (A) Kaplan Meier plot for survival of patients with mesothelioma of the specified histologic subtypes. (B) Representative example of MET staining pattern seen in mesothelioma tissue microarray sections. Magnification × 200. (C) Kaplan Meier plots for survival of patients with mesothelioma according to level of expression of MET. p value was generated by Log-rank (Mantel Cox) test.
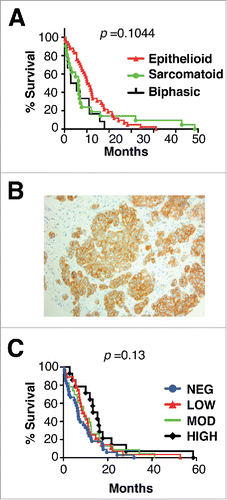
Figure 1. Histology, MET receptor expression and survival analysis of patients with malignant pleural mesothelioma. (A) Kaplan Meier plot for survival of patients with mesothelioma of the specified histologic subtypes. (B) Representative example of MET staining pattern seen in mesothelioma tissue microarray sections. Magnification × 200. (C) Kaplan Meier plots for survival of patients with mesothelioma according to level of expression of MET. p value was generated by Log-rank (Mantel Cox) test.

Figure 2. Sequence and expression of candidate MET-specific CARs in human T-cells. (A) Targeting moieties were derived from the NK1 splice variant of HGF and contained the indicated mutations. Both M2.2 and cM2.2 contain a D127N revertant mutation which restores the naturally occurring sequence found in human NK1. (B) Cartoon structure of CARs. The horizontal line indicates the transmembrane domain. (C) Representative examples of cell surface expression of the indicated CARs. Detection was performed by flow cytometry after incubation with the anti-Myc 9e10 antibody. Percentage positivity has been calculated with respect to staining by secondary antibody alone. Data are representative of 10 independent replicates. (D) Expression of CARs in human T-cells was also detected by western blotting, performed under reducing conditions and probed with an anti-CD3ζ antibody. Arrowed CAR bands are of the predicted molecular mass while the endogenous T-cell receptor-associated CD3ζ band (predicted molecular mass 18 kDa) serves as a loading control.
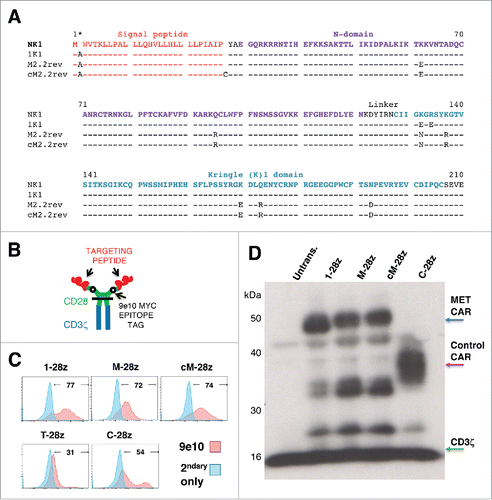
Figure 2. Sequence and expression of candidate MET-specific CARs in human T-cells. (A) Targeting moieties were derived from the NK1 splice variant of HGF and contained the indicated mutations. Both M2.2 and cM2.2 contain a D127N revertant mutation which restores the naturally occurring sequence found in human NK1. (B) Cartoon structure of CARs. The horizontal line indicates the transmembrane domain. (C) Representative examples of cell surface expression of the indicated CARs. Detection was performed by flow cytometry after incubation with the anti-Myc 9e10 antibody. Percentage positivity has been calculated with respect to staining by secondary antibody alone. Data are representative of 10 independent replicates. (D) Expression of CARs in human T-cells was also detected by western blotting, performed under reducing conditions and probed with an anti-CD3ζ antibody. Arrowed CAR bands are of the predicted molecular mass while the endogenous T-cell receptor-associated CD3ζ band (predicted molecular mass 18 kDa) serves as a loading control.

Figure 3. Assessment of specificity of candidate MET targeted CARs using NIH3T3-based artificial antigen presenting cells (AAPC) – I. (A) NIH3T3 fibroblasts were engineered to express human MET, CD44v6 or both molecules. Expression was detected by flow cytometry. Percentage positivity has been calculated with respect to staining by an isotype control antibody. Data are representative of 3 independent experiments. (B) Transduction efficiency of human T-cells engineered to express the indicated candidate MET-specific CARs (1–28z, M-28z, cM-28z), control CARs targeted against ErbB dimers (T-28z) or control CAR targeted with a scrambled 20mer peptide (C-28z). (C) CAR-engineered T-cells were co-cultivated with the indicated NIH3T3-based AAPC for 24 or 48 hours at the specified effector:target ratios. After removal of T-cells by careful washing with PBS, residual viability of NIH3T3 cells was determined by MTT assay, making comparison with a parallel culture of the corresponding NIH3T3 cells alone. (D) Interferon-γ content of supernatants harvested from these co-cultures was quantified by ELISA. Data in (B)-(D) show mean ± SD of 5 independent replicate experiments. *p < 0.05; ** p < 0.01; ***p < 0.001, making comparison with untrans(duced) T-cells or, where indicated, between CAR T-cells under the appropriate horizontal line.
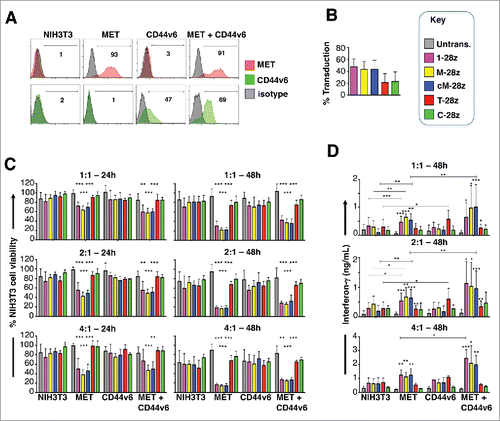
Figure 3. Assessment of specificity of candidate MET targeted CARs using NIH3T3-based artificial antigen presenting cells (AAPC) – I. (A) NIH3T3 fibroblasts were engineered to express human MET, CD44v6 or both molecules. Expression was detected by flow cytometry. Percentage positivity has been calculated with respect to staining by an isotype control antibody. Data are representative of 3 independent experiments. (B) Transduction efficiency of human T-cells engineered to express the indicated candidate MET-specific CARs (1–28z, M-28z, cM-28z), control CARs targeted against ErbB dimers (T-28z) or control CAR targeted with a scrambled 20mer peptide (C-28z). (C) CAR-engineered T-cells were co-cultivated with the indicated NIH3T3-based AAPC for 24 or 48 hours at the specified effector:target ratios. After removal of T-cells by careful washing with PBS, residual viability of NIH3T3 cells was determined by MTT assay, making comparison with a parallel culture of the corresponding NIH3T3 cells alone. (D) Interferon-γ content of supernatants harvested from these co-cultures was quantified by ELISA. Data in (B)-(D) show mean ± SD of 5 independent replicate experiments. *p < 0.05; ** p < 0.01; ***p < 0.001, making comparison with untrans(duced) T-cells or, where indicated, between CAR T-cells under the appropriate horizontal line.

Figure 4. Assessment of specificity of candidate MET targeted CARs using NIH3T3-based artificial antigen presenting cells (AAPC) – II. (A) NIH3T3 fibroblasts were engineered to express human MET or Syndecan-1. Expression was detected by flow cytometry. Percentage positivity has been calculated with respect to staining by an isotype control antibody. Data are representative of 3 independent experiments. (B) Transduction efficiency of human T-cells engineered to express the indicated candidate MET-specific CARs (1–28z, M-28z, cM-28z), control CARs targeted against ErbB dimers (T-28z) or control CAR targeted with a scrambled 20mer peptide (C-28z). (C) CAR-engineered T-cells were co-cultivated with the indicated NIH3T3-based AAPC for 24 or 48 hours at the specified effector:target ratios. After removal of T-cells by careful washing with PBS, residual viability of NIH3T3 cells was determined by MTT assay, making comparison with a parallel culture of the corresponding NIH3T3 cells alone. Data in (B)-(C) show mean ± SD of 3 independent replicate experiments. ***p < 0.001, making comparison with untrans(duced) T-cells.
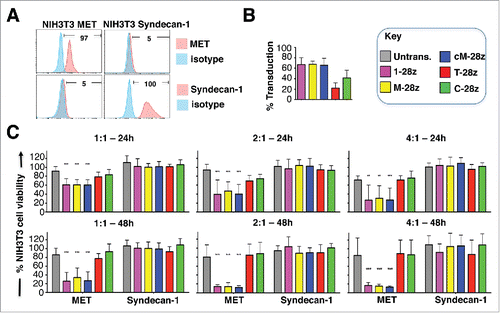
Figure 4. Assessment of specificity of candidate MET targeted CARs using NIH3T3-based artificial antigen presenting cells (AAPC) – II. (A) NIH3T3 fibroblasts were engineered to express human MET or Syndecan-1. Expression was detected by flow cytometry. Percentage positivity has been calculated with respect to staining by an isotype control antibody. Data are representative of 3 independent experiments. (B) Transduction efficiency of human T-cells engineered to express the indicated candidate MET-specific CARs (1–28z, M-28z, cM-28z), control CARs targeted against ErbB dimers (T-28z) or control CAR targeted with a scrambled 20mer peptide (C-28z). (C) CAR-engineered T-cells were co-cultivated with the indicated NIH3T3-based AAPC for 24 or 48 hours at the specified effector:target ratios. After removal of T-cells by careful washing with PBS, residual viability of NIH3T3 cells was determined by MTT assay, making comparison with a parallel culture of the corresponding NIH3T3 cells alone. Data in (B)-(C) show mean ± SD of 3 independent replicate experiments. ***p < 0.001, making comparison with untrans(duced) T-cells.

Figure 5. Characterization of human malignant pleural mesothelioma cell lines. The indicated human MPM cell lines were analyzed by flow cytometry for expression of MET (A), Syndecan-1 (B) or CD44v6 (C). PC3 LN3 cells were used as a positive control for MET and Syndecan-1 expression, while T47D cells were used as a positive control for CD44v6 expression. Untransduced T-cells were also analyzed for expression of these molecules. Data are representative of 3 independent experiments, all of which yielded similar findings.
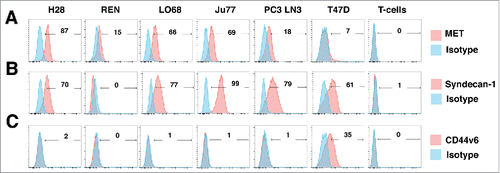
Figure 5. Characterization of human malignant pleural mesothelioma cell lines. The indicated human MPM cell lines were analyzed by flow cytometry for expression of MET (A), Syndecan-1 (B) or CD44v6 (C). PC3 LN3 cells were used as a positive control for MET and Syndecan-1 expression, while T47D cells were used as a positive control for CD44v6 expression. Untransduced T-cells were also analyzed for expression of these molecules. Data are representative of 3 independent experiments, all of which yielded similar findings.

Figure 6. In vitro cytotoxic activity of MET re-targeted CAR T-cells against malignant pleural mesothelioma cell lines. CAR engineered T-cells (transduction efficiency shown in A) were co-cultivated with malignant pleural mesothelioma cells for 48 hours at the indicated effector:target ratios. All CAR T-cells co-expressed the 4αβ chimeric cytokine receptor. (B) After removal of T-cells, residual viable tumor was quantified by MTT assay, making comparison with a parallel culture of tumor cells alone (set to 100%). (C) Supernatants collected from these cultures were analyzed for interferon-γ content. Data show mean ± SD of 3 independent replicate experiments. *p < 0.05; ** p < 0.01; ***p < 0.001, making comparison with untrans(duced) T-cells or, where indicated, between CAR T-cells under the appropriate horizontal line.
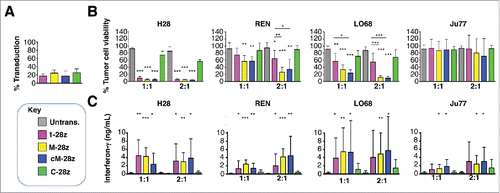
Figure 6. In vitro cytotoxic activity of MET re-targeted CAR T-cells against malignant pleural mesothelioma cell lines. CAR engineered T-cells (transduction efficiency shown in A) were co-cultivated with malignant pleural mesothelioma cells for 48 hours at the indicated effector:target ratios. All CAR T-cells co-expressed the 4αβ chimeric cytokine receptor. (B) After removal of T-cells, residual viable tumor was quantified by MTT assay, making comparison with a parallel culture of tumor cells alone (set to 100%). (C) Supernatants collected from these cultures were analyzed for interferon-γ content. Data show mean ± SD of 3 independent replicate experiments. *p < 0.05; ** p < 0.01; ***p < 0.001, making comparison with untrans(duced) T-cells or, where indicated, between CAR T-cells under the appropriate horizontal line.

Figure 7. Ectopic overexpression of CD44v6 does not render mesothelioma tumor cells more amenable to destruction by MET re-targeted CAR T-cells. Mesothelioma tumor cell lines were engineered to over-express CD44v6 (v6). (A) Transduction efficiency of human T-cells, engineered to express the indicated CARs. (B) CAR-engineered T-cells were co-cultivated with unmodified or v6-engineered malignant pleural mesothelioma cells at a 1:1 effector:target ratio and for the indicated interval. An MTT assay was performed after 72 hours to quantify residual tumor cell viability. (C) Supernatants were harvested from these co-cultivations after 48 hours and were analyzed for interferon-γ content by ELISA. All data shown are mean ± SD of 3 independent replicate experiments. *p < 0.05; ** p < 0.01; ***p < 0.001 making comparison with untrans(duced) T-cells.
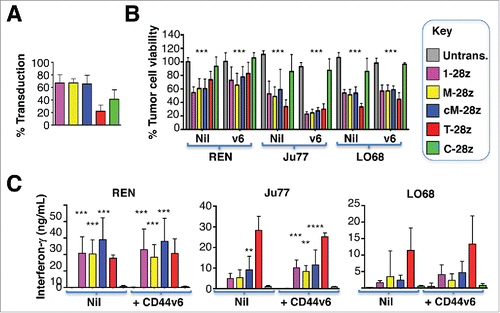
Figure 7. Ectopic overexpression of CD44v6 does not render mesothelioma tumor cells more amenable to destruction by MET re-targeted CAR T-cells. Mesothelioma tumor cell lines were engineered to over-express CD44v6 (v6). (A) Transduction efficiency of human T-cells, engineered to express the indicated CARs. (B) CAR-engineered T-cells were co-cultivated with unmodified or v6-engineered malignant pleural mesothelioma cells at a 1:1 effector:target ratio and for the indicated interval. An MTT assay was performed after 72 hours to quantify residual tumor cell viability. (C) Supernatants were harvested from these co-cultivations after 48 hours and were analyzed for interferon-γ content by ELISA. All data shown are mean ± SD of 3 independent replicate experiments. *p < 0.05; ** p < 0.01; ***p < 0.001 making comparison with untrans(duced) T-cells.

Figure 8. In vivo anti-tumor activity of MET re-targeted CAR T-cells against an established malignant pleural mesothelioma xenograft. (A) T-cells were engineered to express the indicated test (cM-28z) or control CAR (C-28z), co-expressed with 4αβ. NOD SCID γc null mice were inoculated i.p. with 5 × 104 ffLuc/ RFP+ REN tumor cells. Following assignment to groups with comparable mean established tumor burden, mice were treated in a blinded fashion 7 d after tumor implantation (arrowed) with cM-28z+ or C-28z+ CAR T-cells, administered to groups of 5 mice at (L)ow or (H)igh doses of 2.5 × 106 or 10 × 106 T-cells respectively. Comparison was made with untrans(duced) T-cells (10 × 106 cells; n = 5 mice) or PBS (n = 8 mice). Serial bioluminescence imaging of animals that received low dose (B) or high doses (C) of the indicated T-cell populations are shown. The PBS group is shown on each panel for reference. (D) Bioluminescence images of representative mice are shown on the same imaging scale (E) over the course of the experiment. (F) Serial weights of mice. All data are mean ± SD of n = 5–8 mice. *p < 0.05; ** p < 0.01 making comparison with PBS-treated mice.
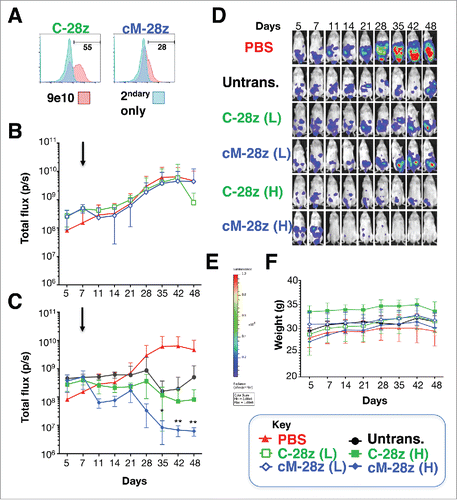
Figure 8. In vivo anti-tumor activity of MET re-targeted CAR T-cells against an established malignant pleural mesothelioma xenograft. (A) T-cells were engineered to express the indicated test (cM-28z) or control CAR (C-28z), co-expressed with 4αβ. NOD SCID γc null mice were inoculated i.p. with 5 × 104 ffLuc/ RFP+ REN tumor cells. Following assignment to groups with comparable mean established tumor burden, mice were treated in a blinded fashion 7 d after tumor implantation (arrowed) with cM-28z+ or C-28z+ CAR T-cells, administered to groups of 5 mice at (L)ow or (H)igh doses of 2.5 × 106 or 10 × 106 T-cells respectively. Comparison was made with untrans(duced) T-cells (10 × 106 cells; n = 5 mice) or PBS (n = 8 mice). Serial bioluminescence imaging of animals that received low dose (B) or high doses (C) of the indicated T-cell populations are shown. The PBS group is shown on each panel for reference. (D) Bioluminescence images of representative mice are shown on the same imaging scale (E) over the course of the experiment. (F) Serial weights of mice. All data are mean ± SD of n = 5–8 mice. *p < 0.05; ** p < 0.01 making comparison with PBS-treated mice.
Supplemental material

downloadFromZipFile.pdf

Download PDF (4.3 MB)

Reprints and Corporate Permissions

Please note: Selecting permissions does not provide access to the full text of the article, please see our help page How do I view content?

To request a reprint or corporate permissions for this article, please click on the relevant link below:

Academic Permissions

Please note: Selecting permissions does not provide access to the full text of the article, please see our help page How do I view content?

Obtain permissions instantly via Rightslink by clicking on the button below:

If you are unable to obtain permissions via Rightslink, please complete and submit this Permissions form. For more information, please visit our Permissions help page.