Figures & data
Figure 1. PSCA-CAR T cells containing CD28 or 4-1BB co-stimulatory domains. (a) Diagram of the lentiviral expression cassette with PSCA-CARs containing the humanized scFv (A11 clone) targeting PSCA, with a 129 amino acid modified human IgG4 Fc linker (void of the CH2 domain, ΔCH2), a CD28 or CD4 transmembrane domain, a cytoplasmic CD28 or 4-1BB costimulatory domain, and a cytolytic CD3ζ domain. A truncated non-signaling CD19 (CD19t), separated from the CAR with a T2A ribosomal skip sequence, was expressed for tracking CAR-expressing cells. (b) Mock (untransduced), PSCA-28ζ, or PSCA-BBζ CAR T cells were evaluated by flow cytometry for CD19t expression to detect lentiviral transduction of CARs (left) or Protein L to detect the scFv (right). (c) Ex vivo expansion kinetics for Mock and PSCA-CAR T cells over 25 days in culture. (d) Cell-surface expression of indicated cell-surface markers of PSCA-CAR T cells at end of ex vivo expansion as determined by flow cytometry. All data are representative of at least two independent experiments.
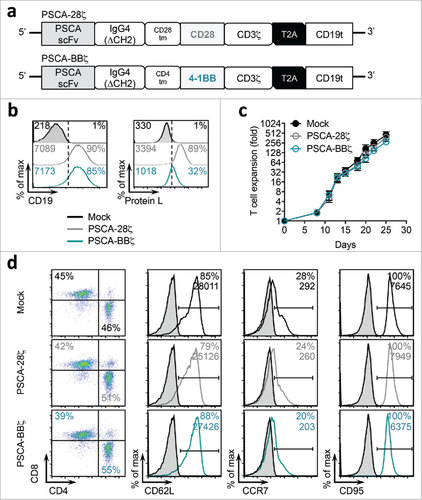
Figure 2. PSCA-BBζ CARs show antigen-dependent cytokine production in vitro. (a) Flow cytometric analysis of PSCA expression in human prostate cancer cell lines. DU145 and PC-3 cell lines were lentivirally transduced to over-express human PSCA under the control of the EF1α promoter (see materials and methods). PC-3-PGK100p cell line was generated by expressing human PSCA under the control of the indicated mutant PGK promoter (PGK100p). LAPC-9 cells endogenously express human PSCA. (b) Quantification of CD137 (top) and CD69 (bottom) expression on Mock, PSCA-28ζ, and PSCA-BBζ CAR T cells following a 1, 4, or 24 hour co-culture with the indicated tumor targets at a 1:2 effector:tumor (E:T) ratio. (c) IFNγ production quantified by ELISA in supernatants from PSCA-CAR T cells cultured overnight with DU145 or DU145-PSCA tumor cells. (d) Same as in (c) from PSCA-CAR T cells cultured overnight with PC-3, PGK100p, or PC-3-PSCA tumor cells. (e) IFNγ production quantified by ELISA in supernatants from PSCA-CAR T cells cultured overnight on plate-bound recombinant human PSCA at varying protein concentrations. (f) Representative FACS plots showing intracellular IFNγ and CD107a degranulation by PSCA-CAR T cells following a 4 – 6 hr co-culture with indicated tumor targets. (g) Quantification of intracellular IFNγ and CD107a degranulation by PSCA-CAR T cells from (f). Data are shown as n = 2 per group ± SD. All data are representative of at least two independent experiments.
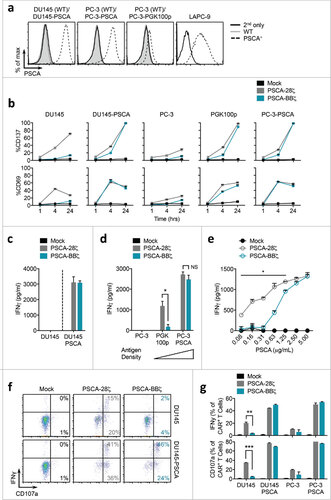
Figure 3. PSCA-CARs with 4-1BB co-stimulation demonstrate improved tumor killing, with reduced T cell exhaustion and greater antigen-specific expansion compared with CD28 co-stimulation in vitro. (a) Representative flow cytometry dot plots of a tumor killing assay comparing Mock, PSCA-28ζ, or PSCA-BBζ CAR T cells following a 3-day co-culture with DU145 or DU145-PSCA tumor cells at a 1:2 E:T ratio. (b) Quantification of tumor killing by PSCA-CAR T cells compared to Mock from (a). (c) Representative flow cytometry zebra plots of PD-1 expression in PSCA-CAR T cells following a 3-day co-culture with indicated tumor targets. (d) Quantification of PD-1 expression on CD8+ CAR+ T cells following a 3-day co-culture with indicated tumor targets at a 1:2 E:T ratio. (e) Quantification of tumor killing and CAR+ T cell count after 4 or 8 days of co-culture with PC-3-PSCA tumor cells at a 1:20 E:T ratio. (f) Quantification of CD137 and PD-1 expression on PSCA-CAR T cells from (e).
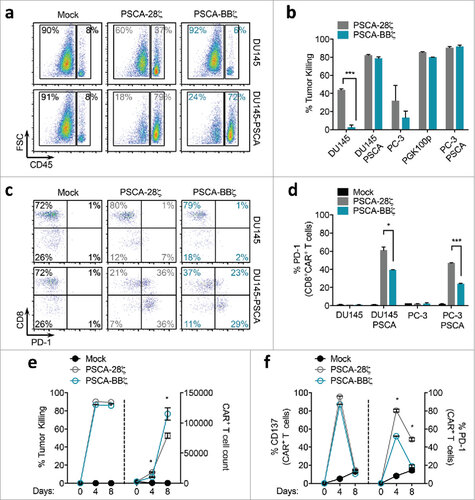
Figure 4. Robust therapeutic efficacy of PSCA-BBζ CAR T cells in subcutaneous and orthotopic bone metastatic human xenograft models of prostate cancer. (a) Tumor volume (mm3) in NSG mice bearing subcutaneous PC-3-PSCA (2.5 × 10⁶) tumors on day 0, treated with Mock or PSCA-BBζ CAR T cells at the indicated doses by intratumoral (i.t.) injection on day 34. N = 4 mice per group. Data are representative of at least two independent experiments. (b) Mice with large tumors (approx. 500 mm3) treated with 5 × 10⁶ Mock or CAR T cells by i.v. injection on day 51. N = 3 mice per group. Data are representative of at least two independent experiments. (c) Immunohistochemistry of PC-3-PSCA tumors, harvested 11 days post i.v. T cell treatment, stained with human CD3 (upper panels) and Granzyme B (lower panels). (d) Mice bearing intratibial tumors, with PC-3 (wild-type) cells (0.2 × 10⁶) in the right hind leg, and PC-3-PSCA cells (0.2 × 10⁶) in the left hind leg. On day 14, mice were treated with 5 × 10⁶ firefly luciferase-positive (∼30%) Mock or PSCA-BBζ CAR T cells by i.v. injection. T cell trafficking was monitored at 4 hours, 1 day, 2 days, and 4 days by non-invasive optical imaging (Xenogen). Quantification of flux images, showing the ratio of T cells that trafficked to PC-3-PSCA vs. PC-3 (wild-type) tumors. N = 4 – 6 mice per group. (e) NSG mice bearing intratibial (left hind leg) PC-3-PSCA-eGFP-ffluc (0.2 × 10⁶). Tumor growth kinetics were monitored by non-invasive optical imaging (Xenogen). On day 14, mice were i.v. injected with 5 × 10⁶ Mock or varying doses of PSCA-BBζ CAR T cells. Representative flux images of mice on day 13 (pre-treatment) and day 33 are shown. (f) Quantification of flux images (with region of interest (ROI) at site of tumor injection) from tumor only, Mock T cells (5 × 10⁶), and PSCA-BBζ CAR T cells (5 × 10⁶, 2.5 × 10⁶, 1 × 10⁶, 0.5 × 10⁶) groups. N ≥ 4 mice per group for CAR groups. Data are representative of at least two independent experiments.
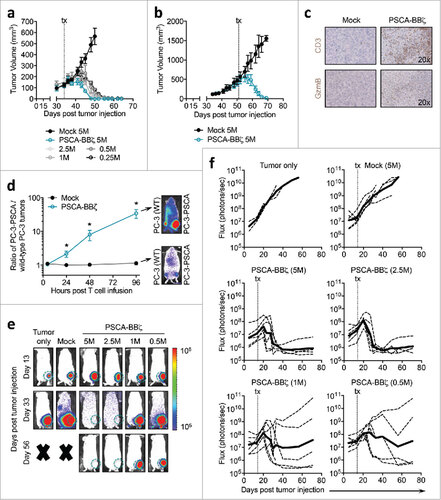
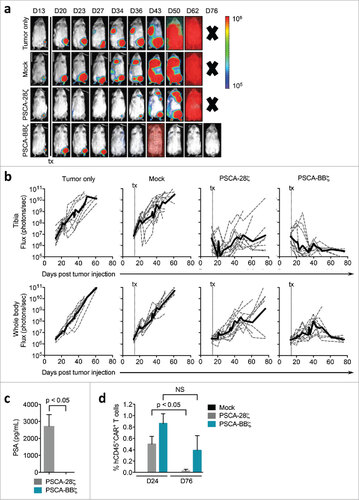
Figure 5. Durable anti-tumor efficacy of PSCA-BBζ CAR T cells compared with PSCA-28ζ CAR T cells in a prostate cancer patient-derived bone metastatic xenograft model. (a) NSG mice bearing intratibial (left hind leg) LAPC-9-eGFP-ffluc (0.15 × 10⁶). Tumor growth kinetics were monitored by non-invasive optical imaging (Xenogen). On day 14, mice were i.v. injected with 5 × 10⁶ Mock, PSCA-28ζ or PSCA-BBζ CAR T cells. Representative flux images of mice on indicated days are shown. (b) Quantification of flux images, with ROI at the tibia (upper panels) or from whole body (lower panels) from each treatment group. (c) PSA levels determined by ELISA from serum harvested from treated mice (n = 2 – 3 per group) at day 76 post tumor injection. (d) Flow cytometric analysis of peripheral blood of mice 24 and 76 days post tumor injection (n = 2 – 3 per group). Data are compiled from two independent in vivo experiments.