Figures & data
Figure 1. Immunohistochemistry staining results. (A) The construction of tissue array (5x), scale bar: 100 μm; (B-F) The staining of immune cells markers: CD68, CD4, CD8, CD3 and CD20 (20x); (G) The staining of cancer stemness markers: membranous CD44v6 (20x), scale bar: 100 μm; (H-I) The staining of epithelial-mesenchymal transition markers: membranous E-cadherin and nuclear Snail (20x), scale bar: 100 μm.
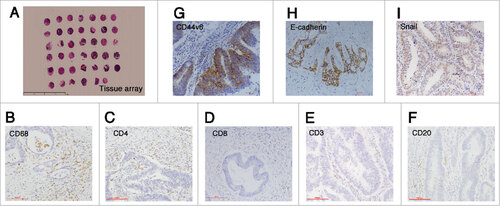
Table 1. The correlations between density of CD68+ macrophages and other immune cells in TF (Spearman rank test).
Table 2. Correlation between CD68+ macrophages and expression of CSC and EMT markers in TF (Spearman rank test).
Figure 2. The survival analyses by Kaplan-Meier survival analysis (Log-rank test). (A-C) High CD20+TC density, high CD68+TF density and low tumor buds predicted favorable overall survival respectively (death/ total); (D) CD68+TFlow TBhigh had the worst survival (CD68+TFlow TBhigh vs CD68+TFhigh TBhigh, p < 0.001; CD68+TFlow TBhigh vs CD68+TFlow TBlow, p < 0.001; CD68+TFlow TBhigh vs CD68+TFhigh TBlow, p = 0.008). In high TB group, when CD68+TF were high, overall survival time was prolonged, which was similar to low TB group (death/ total). ### p < 0.001.
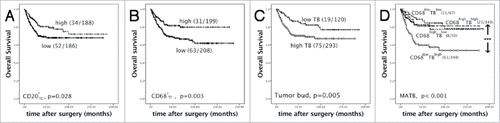
Table 3. The results of multivariate COX proportional hazard model.
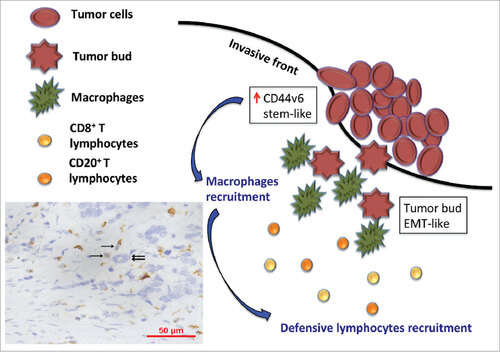
Figure 3. The model shows a hypothesis that tumor cells with stem-like phenotypes recruitment TAMs (brown, single sword) to the invasive front of tumor lesion and surround around tumor buds (double swords). Subsequently, TAMs induce immune response, especially CD8+T and CD20+ B lymphocytes, to eliminate these highly invasive tumor buds.