Figures & data
Figure 1. NK cell CD25 transcript levels are upregulated following dual stimulation of Fc and IL-12 receptors. Healthy donor human NK cells were purified and cultured in medium alone or in the presence of immobilized IgG, IL-12, or IgG and IL-12 (n = 8). Following 24 h stimulation, cells were harvested and RNA was isolated, converted to cRNA, and hybridized to an Affymetrix Genechip, and CD25 expression levels were evaluated. Each row represents an individual donor, and each column represents one of the four treatment conditions in the NK cell assay. Relative hybridization intensities of CD25 expression are shown across all samples, and colors reflect the magnitude of relative expression of CD25. Brighter orange to red corresponds to higher expression and blue corresponds to lower expression.
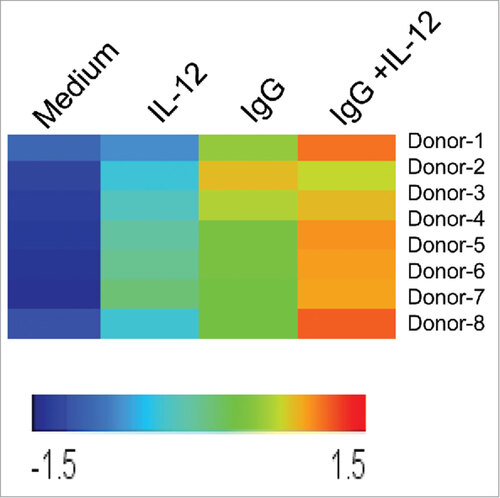
Figure 2. Dual stimulation of NK cells via immobilized IgG and IL-12 leads to increased CD25 expression. (A) Healthy donor NK cells cultured in the presence of medium, IL-12, immobilized IgG, or IgG plus IL-12 were harvested and processed for Real-Time PCR analysis of CD25 (IL-2Rα) transcript levels. Results are given as fold increase in transcript over baseline (medium). (B) Following stimulation for 24 h, NK cells were harvested, and protein lysates were examined via western blot to detect CD25 expression. β-actin was used as a loading control. Three representative donors are shown. (C) NK cells cultured in the different treatment conditions were harvested and stained via flow cytometry to evaluate surface expression of CD56 and CD25. (D) NK cells were cultured in the presence of medium (control) or immobilized IgG plus IL-12, and were collected at sequential time points (8 h, 12 h, and 24 h) and stained via flow cytometry to evaluate surface expression of CD56 and CD25 over time.
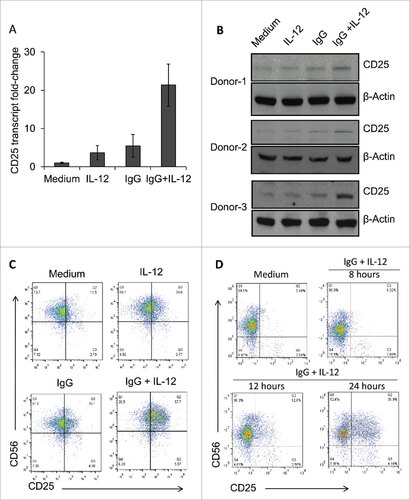
Figure 3. Various combinations of FcR and cytokine stimulation enhance NK cell CD25 expression. Healthy donor human NK cells were isolated and cultured for 24 h in medium alone or in the presence of immobilized IgG, IL-2,-12, -15, -18, -21 or the combination of IgG and those cytokines. Cells were harvested and CD25 levels were examined by flow cytometry.
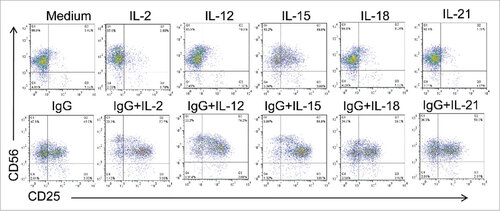
Figure 4. FcR and IL-12R dual stimulation alters the expression of NK cell surface markers. NK cells were isolated and cultured in medium alone or in the presence of immobilized IgG, IL-12, or IgG and IL-12. (A) After 24 h, cells were collected and stained via flow cytometry to evaluate surface expression of CD56 and NK cell activation markers (A) CD25, (B) NKG2D and (C) CD69, or NK cell inhibitory markers (D) CD158 a, or (E) CD158b.
Figure 5. FcR and IL-12R dual stimulation variably modifies the expression of NK cell cytokine receptors sharing the common γ chain. NK cells were isolated and cultured in medium alone or in the presence of immobilized IgG, IL-12, or IgG and IL-12. After 24 h, cells were collected and processed for Real-Time PCR analysis of various cytokine receptor transcript levels. Results are given as average fold increase in transcript over baseline (medium) for three independent experimental donors. (A) IL-2Rα, (B) IL-4R, (C) IL-7R, (D) IL-9R (E) IL-15Rα, and (F) IL-21R.
Figure 6. NK cells pre-treated with immobilized IgG and IL-12 are more responsive to low-dose IL-2. Healthy donor NK cells were purified and cultured in the presence of medium alone, IL-12, immobilized IgG, or the combination of IgG and IL-12. After 24 hours, cells were collected, washed, and rested. Cells were left untreated (control) or treated with low dose IL-2 (10 pg/mL) or high dose IL-2 (10 ng/mL). (A) Cells were incubated for 15 minutes and were subsequently stained for pSTAT5 expression via intracellular flow cytometry. (B) For interferon-gamma analysis, NK cells were incubated in 96-well plates for 24 hours. At the end of the incubation period, culture supernatants were collected and analyzed by ELISA. Both figures depict the average of 3 independent donors ± SEM. (C) The lytic activity of untreated or immobilized IgG and IL-12 stimulated NK cells incubated with or without low dose IL-2 (10 pg/mL) or high dose IL-2 (10 ng/mL) was then assessed in a standard 4 hr chromium release assay using K562 tumor cells as targets at a 25:1 effector:target ratio or trastuzumab-coated SK-BR-3 cells at a 6.25:1 effector:target ratio (D). The percentage of lysis was calculated as previously described the graph depicts the results from one representative donor ± SD. # P < 0.05
Figure 7. Combination therapy with the monoclonal antibody cetuximab and IL-12 induces CD25 expression in patients with head and neck cancer. Patient blood was drawn at visits pre- and post-therapy (Cetuximab and IL-12 Phase I clinical trial; NCI protocol 8860; local protocol OSU 11010). Cryopreserved patient PBMC were thawed and analyzed via flow cytometry to measure CD56+ NK cell CD25 expression. Bars represent the percent CD25 positive NK cells in total PBMC at baseline and throughout various cycles (C) of cetuximab and IL-12 therapy (D1 is drawn pre-therapy, D2 after cetuximab administration, and D5 after patient has received cetuximab and IL-12 administration). (A) Three representative patients with extended PFS and elevated CD25 levels following therapy. (B) Three representative patients with short PFS and low to decreased CD25 levels following therapy. EOT = end of treatment.