Figures & data
Figure 1. Glioma‐induced microglia tumor‐supporting phenotype is associated with increased H4K16 acetylation. (A) qPCR analysis of Il1β, Il6, Mmp14, Ccl22, Chil3 and Nos2 mRNA expression in BV2 microglia grown as monocultures or with C6 glioma cells as segregated cocultures (key); results are presented relative to those of each monoculture, set as 1. (B) Immunoblot analysis of MMP14 and β-actin (right margin, molecular size, in kilodaltons (kDa)) with quantification (C) in BV2 microglia cultured for 4 h as a monoculture or with C6 glioma cells as segregated coculture; results are presented to relative to those of BV2 microglia monoculture, set as 1. (D) Quantification of the migration of C6 glioma cells in Transwells with BV2 microglia or C6-cocultured BV2 microglia in the lower compartment; results are presented relative to those of C6 cells alone, set as 1. (E and F) Immunoblot analysis of H4K16ac and β-actin (right margin, molecular size, in kilodaltons (kDa)) (E) with quantification (F) in BV2 microglia control (0 h) or cultured for 2 h, 4 h or 6 h as monoculture or with C6 glioma cells as segregated coculture; results are presented to relative to those of BV2 microglia control (0 h), set as 1. (G) Confocal microscopy of BV2 microglia cultured for 4 h as a monoculture or with C6 glioma cells as segregated coculture, with immunostaining for H4K16ac and Hoechst nuclear counterstain. Scale bar, 10 μm. ns, non-significant, #P < 0.05, ##P < 0.01, ###P < 0.001 and ####P < 0.0001 (two-tailed Student's t-test). Data are from three independent experiments (A to D) or five independent experiments (E and F) (mean and s.d.).
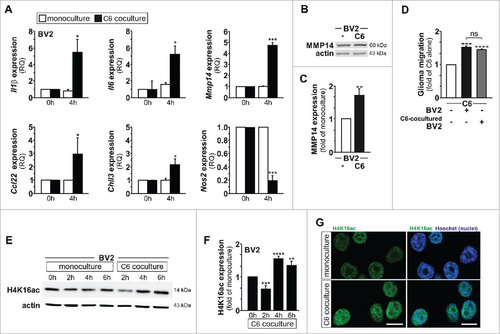
Figure 2. Increased H4K16 acetylation expression levels are observed in microglia in mouse glioblastoma tumor model. (A and B) Confocal microscopy of tumors formed in mouse brain 1 week after injection of GFP-GL261 cells, with immunostaining for H4K16ac and Iba1 (microglia marker, depicted in white) and Hoechst nuclear counterstain. Scale bars, 20 µm (A), 10 µm (B). Picture for depicted microglia outside the tumor site was taken 2 mm from tumor border. In the depicted images, some microglia cells are pointed out with a yellow arrow head. Data are representative of one independent experiment with three mice. (C) Quantification of the signal intensity of microglial H4K16ac at tumor site or distinct from tumor site at 1 week after injection of cells as in A. ###P < 0.001 (two-tailed Student's t-test). Data are pooled from over 100 microglia cells from each mouse. Each dot represents the mean value of microglia cells from one mouse and the line indicates the median value of each group.
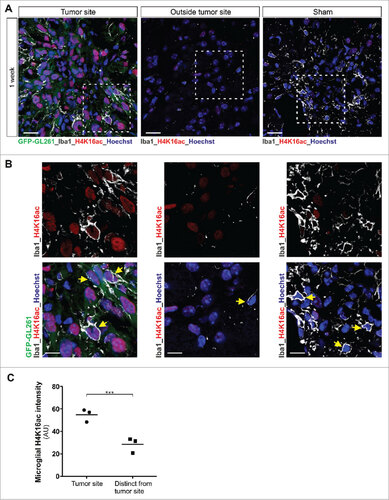
Figure 3. Nuclear relocalisation of microglial SIRT1 is observed upon glioma coculture. (A to D) Immunoblot analysis of SIRT1 (A) or hMOF (C) and β-actin (A and C) with quantification (B and D) in BV2 microglia control (0 h) or cultured for 2 h, 4 h or 6 h as monoculture or with C6 glioma cells as segregated coculture; results are presented relative to those of BV2 microglia control (0 h), set as 1. (E) Immunoblot analysis of SIRT1, actin and lamin β1 lysate in subcellular fractions of BV2 microglia grown for 4 h as monocultures or with C6 cells as segregated cocultures. (F) Quantification of SIRT1 in subcellular fractions of e; results are presented relative to those of BV2 monocultures, set as 1. (G) Confocal microscopy of BV2 microglia grown for 4 h as monocultures or with C6 cells as segregated cocultures, with immunostaining for SIRT1 and Hoechst nuclear counterstain. Last row of the depicted pictures are higher magnification of the merged confocal images. Scale bar, 20 µm. #P < 0.05, ##P < 0.01, ###P < 0.001 (two-tailed Student's t-test). Data are from three independent experiments (A, B, C, D and G) or four independent experiments (E and F) (mean and s.d.).
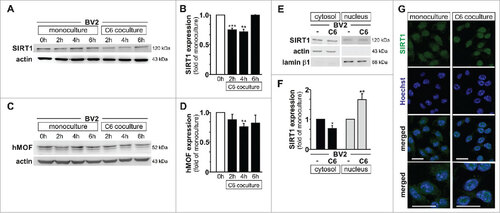
Figure 4. Increased SIRT1 expression is observed in microglia in mouse glioblastoma tumor model. (A and B) Confocal microscopy of tumors formed in mouse brain 1 week after injection of GFP-GL261 cells, with immunostaining for SIRT1 and Iba1 (microglia marker, depicted in white) and Hoechst nuclear counterstain. Scale bars, 20 µm (A), 10 µm (B). Picture for depicted microglia outside the tumor site was taken 6 mm from tumor border. In the depicted images, some microglia cells are pointed out with a yellow arrow head. Data are representative of one independent experiment with three mice.
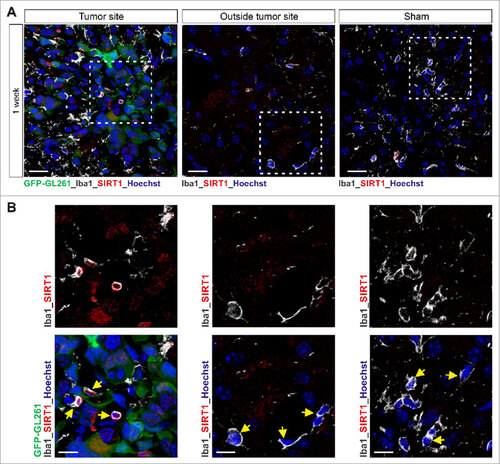
Figure 5. SIRT1 interacts with and deacetylates hMOF. (A) Immunoblot analysis of SIRT1 and hMOF in BV2 microglia cultured for 4 h as monoculture or with C6 glioma cells as segregated coculture assessed after immunoprecipitation with antibody to SIRT1 or immunoglobulin G (IgG; control). IgG bands are indicated with an asterisk, whereas proteins of interest are indicated with an arrow head. (B) In situ proximity-ligation assay (PLA) with quantifications (C) of SIRT1-hMOF interactions in BV2 microglia grown for 4 h as monocultures or with C6 cells as segregated cocultures; results are presented relative to those of BV2 monocultures, set as 1. (D) Immunoblot analysis of hMOF in BV2 microglia cultured for 4 h as monoculture or with C6 glioma cells as segregated coculture assessed after immunoprecipitation with antibody to acetyl lysine (acK) or immunoglobulin G (IgG; control). (E) In situ proximity-ligation assay (PLA) with quantification (F) of acK-hMOF interactions in BV2 microglia grown for 4 h as monocultures or with C6 cells as segregated cocultures; results are presented relative to those of BV2 monocultures, set as 1. ##P < 0.01and ###P < 0.001 (two-tailed Student's t-test). Data are from three independent experiments (mean and s.d.).
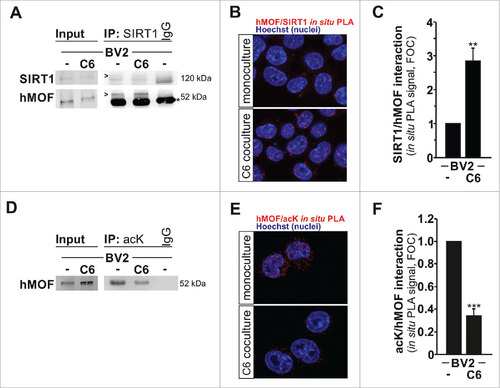
Figure 6. The H4K16 HAT hMOF is recruited to microglial upregulated genes. BV2 microglia are cultured for 4 h as monocultures or with C6 glioma cells as segregated cocultures and immunoprecipitated with hMOF (A, C, E, G and I) or H4K16ac (B, D, F, H and J) antibodies. hMOF and H4K16ac ChIP signals in 1 kb region downstream of the transcription start sites for the genes Il1β, Il6, Mmp14, Ccl22 and Chil3 were analyzed using qPCR and normalized to the levels of input DNA. BV2 microglia grown as monocultures serves as a control, set as 1. #P < 0.05 and ##P < 0.01 (two-tailed Student's t-test). Data are from three (Ccl22 and Chil3) or five (Il1β, Il6 and Mmp14) independent experiments (mean and s.d.).
Figure 7. Modulation of H4K16ac status impacts on microglia tumor supporting phenotype. (A and C) Immunoblot analysis of H4K16ac and H3 in BV2 microglia pre-treated with EX527 (SIRT1 activity inhibitor) or SRT1720 (SIRT1 activity activator) cultured for 4 h as monoculture or with C6 glioma cells as segregated coculture. (B and D) Quantification of the migration of C6 glioma cells in Transwells with BV2 microglia pre-treated with EX527 or SRT1720 in the lower compartment; results are presented relative to those of C6 cells exposed to BV2 microglia control (ctrl), set as 1. (E and G) Immunoblot analysis of H4K16ac and H3 as well as SIRT1 (E) and hMOF (G) in BV2 microglia transfected with SIRT1-specific siRNA (siRNA SIRT1) or hMOF-specific siRNA (siRNA hMOF) or control siRNA (siRNA Ctrl) cultured for 4 h as monoculture or with C6 glioma cells as segregated coculture. (F and H) Quantification of the migration of C6 glioma cells in Transwells with BV2 microglia transfected with siRNA SIRT1, siRNA hMOF or siRNA Ctrl in the lower compartment; results are presented relative to those of C6 cells exposed to BV2 microglia transfected with siRNA Ctrl, set as 1. #P < 0.05, ##P < 0.01, ###P < 0.001 and ####P < 0.0001 (two-tailed Student's t-test). Data are from three independent experiments (D and G) and six independent experiments (B and F) (mean and s.d.).
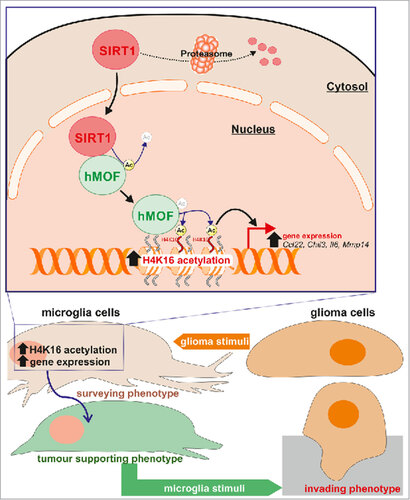
Figure 8. Proposed pathway. Schematic representation illustrating that in microglia upon exposure to glioma cells, SIRT1 can relocate to the nucleus where it interacts with and deacetylates hMOF, thereby promoting the chromatin recruitment of this H4K16 histone acetyltranferase at promoter regions of glioma-induced microglial regulated genes.