Figures & data
Figure 1. Health burden of naïve and immunized mice upon infection with Salmonella and E. coli. Naïve and immunized CT26 tumor-bearing mice were infected intravenously (A – C) or intratumorally (D – F) with 5#107 E. coli Symbioflor-2, 5#107 SL7207 or 5#106 SF200 (ΔlpxR9 ΔpagL7 ΔpagP8 ΔaroA ΔydiV ΔfliF). Bodyweight was measured with a scale and used as indicator of general health. PBS served as a negative control. (G) Photograph of mice infected intravenously with SF200 24 hpi. Displayed are values of mean ± SD. Results are representative of two independent experiments with six replicates in each group. p-Values indicate differences between infected mice under naïve and immunized conditions. #, p < 0.05; ##, p < 0.01.
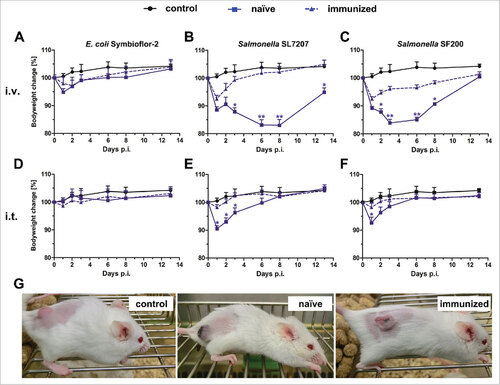
Figure 2. Biodistribution of Salmonella variants in naïve and immunized mice upon intravenous infection. Naïve and immunized CT26 tumor-bearing mice were infected intravenously with 5#106 SL7207 or SF200 (ΔlpxR9 ΔpagL7 ΔpagP8 ΔaroA ΔydiV ΔfliF). The bacterial load in blood (A), spleen (B), liver (C) and tumor (D) were determined by plating over the course of infection. Displayed are values of mean ± SD of four replicates in each group. The inset in displays enlarged the numbers of CFUs found in the tumors of both types of mice at 24 hrs upon infection with SF200. Clearly, at this time point tumors of immunized mice are colonized ten-fold lower than tumors of naïve mice. At later time points equal colonization is observed. #, p < 0.05; ###, p < 0.001.
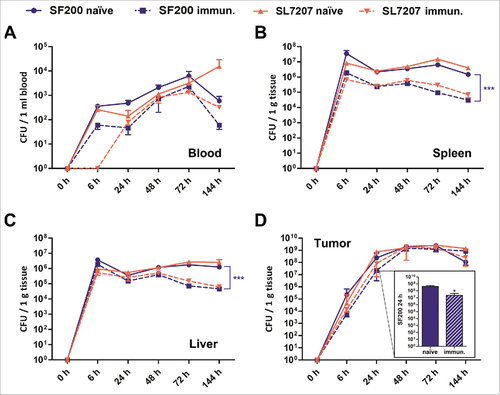
Figure 3. Pre-exposure reduces the formation of necrosis in the early stages of infection upon intravenous infection with Salmonella. CT26 tumor-bearing mice were infected with 5#106 SF200 (ΔlpxR9 ΔpagL7 ΔpagP8 ΔaroA ΔydiV ΔfliF) via intravenous infection. 48 hpi, tumors were isolated and prepared for immune histochemical staining. Immunized mice are less prone to necrosis formation and hypoxia. Dispersion of salmonellae in and beyond necrotic center, and presence of neutrophils in immediate proximity to the salmonellae was only clearly visible in naïve mice. “N” denotes areas of necrosis. Hypoxia was stained with antibodies against metabolites of pimonidazole-HCl, otherwise administered i.v. 30 mins prior to isolation. Myeloperoxidase (MPO) denotes presence of neutrophilic granulocytes, and Salmonella was stained using a specific antibody. Differential staining was performed on consecutive sections. Scale bar corresponds to 100 μm. Images representative of at least 3 replicates are displayed.
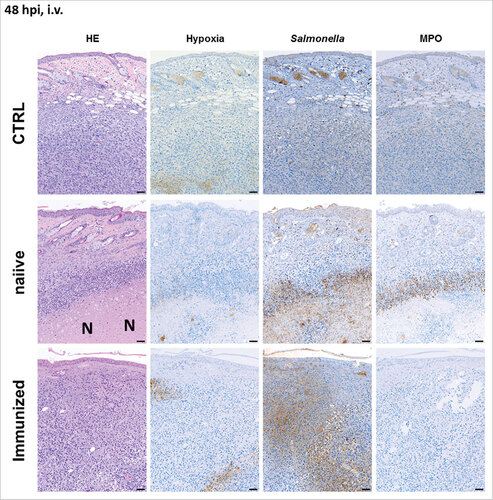
Figure 4. Tumor development upon intravenous infection with Salmonella and probiotic E. coli in naïve and immunized mice. Naïve (A – C) and immunized (D – F) CT26 tumor bearing mice were infected intravenously with 5#107 E. coli Symbioflor-2, 5#106 SL7207 or 5#106 SF200 (ΔlpxR9 ΔpagL7 ΔpagP8 ΔaroA ΔydiV ΔfliF). Tumor volumes were calculated on the basis of caliper measurements following infection with E. coli Symbioflor-2, SL7207 and SF200. PBS served as negative control and is depicted as mean of five replicates. Tumor progression of individual mice is displayed (blue).. Results are representative of two independent experiments.
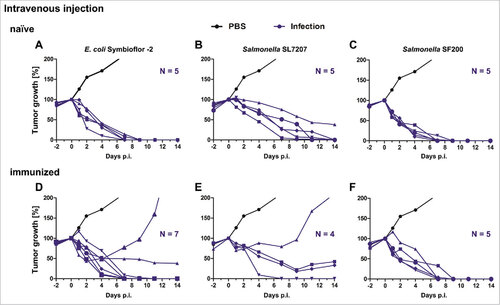
Figure 5. Tumor development upon intratumoral infection with Salmonella and probiotic E. coli in naïve and immunized mice. Naïve (A – C) and immunized (D – F) CT26 tumor bearing mice were infected intravenously with 5#107 E. coli Symbioflor-2, 5#106 SL7207 or 5#106 SF200 (ΔlpxR9 ΔpagL7 ΔpagP8 ΔaroA ΔydiV ΔfliF). Tumor volumes were calculated on the basis of caliper measurements following infection with E. coli Symbioflor-2, SL7207 and SF200. PBS served as negative control and is depicted as mean of five replicates. Tumor progression of individual mice is displayed (blue). Results are representative of two independent experiments.
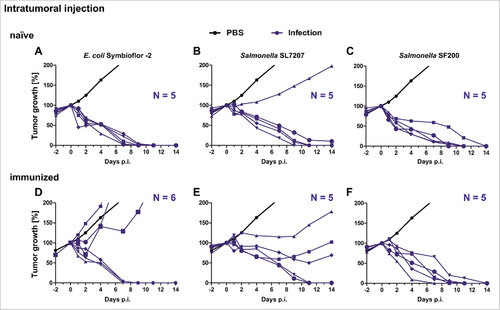
Figure 6. Cytokine, chemokine and growth factor detection in infected tumors of naïve and immunized mice 48 hpi. Naïve (n) and immunized (i) CT26 tumor bearing mice were infected intravenously with 5#106 SL7207 or 5#106 SF200 (ΔlpxR9 ΔpagL7 ΔpagP8 ΔaroA ΔydiV ΔfliF). The cytokine leves of IL-1β (A), IL-6 (B), IL-10 (C), IFN-γ (D), MIP-1α (E) and TNF-α (F) were analyzed using a Bio-PlexPro™ kit 48 hpi. Uninfected tumors from uninfected naïve and immunized mice served as control. Displayed are values of mean ± SD of four replicates in each group.
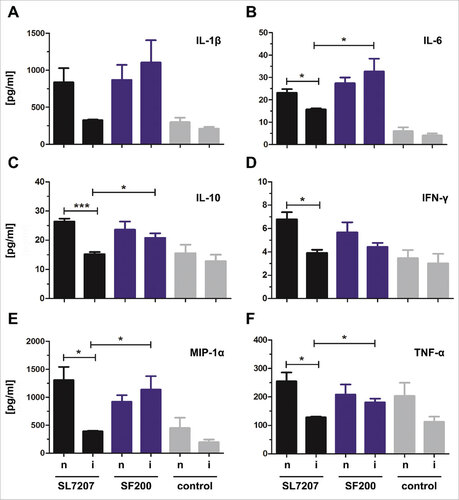
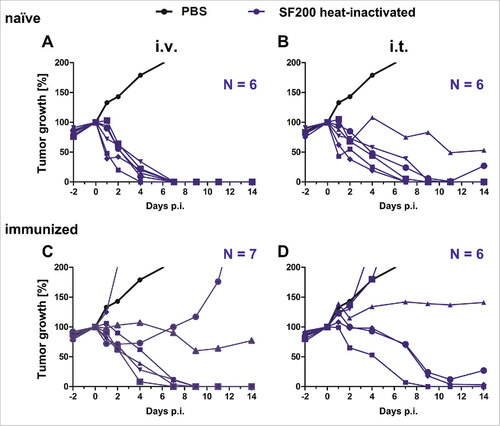
Figure 7. Tumor development upon infection with heat-inactivated Salmonella SF200 in naïve and immunized mice. Naïve (A – B) and immunized (C – D) CT26 tumor bearing mice were infected intravenously (A and C) and intratumorally (B and D) with or 5#106 heat-inactivated SF200 (ΔlpxR9 ΔpagL7 ΔpagP8 ΔaroA ΔydiV ΔfliF). Tumor volumes were calculated on the basis of caliper measurements following infection with SF200. PBS served as negative control and is depicted as mean of five replicates. Tumor progression of individual mice is displayed (blue). Results are representative of two independent experiments