
Figures & data
Figure 1. Comparison of PD-1 expression between lower grade gliomas and glioblastoma (GBM) in CGGA (A) and TCGA (B) datasets. PD-1 expression according to IDH mutation status cross grade II to grade IV gliomas in CGGA (C) and TCGA (D) datasets.
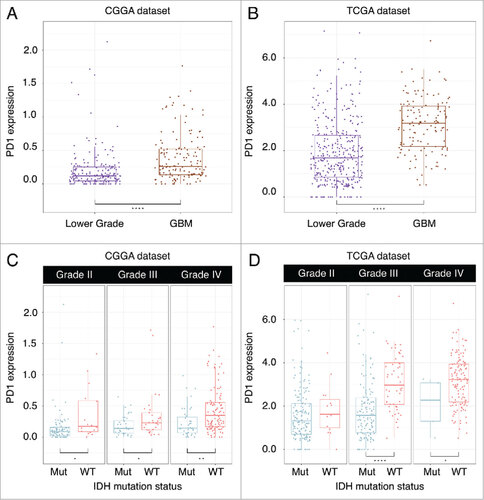
Figure 2. PD-1 expression in different molecular subtypes of TCGA transcriptional classification scheme in CGGA (A) and TCGA (B) datasets. ROC curves of PD-1 expression to predict mesenchymal subtype in CGGA (C) and TCGA (D) datasets.
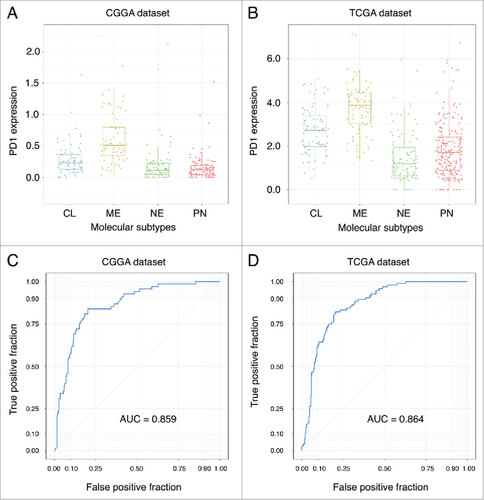
Figure 3. PD-1 related biological process by gene ontology analysis in CGGA (A) and TCGA (B) datasets.
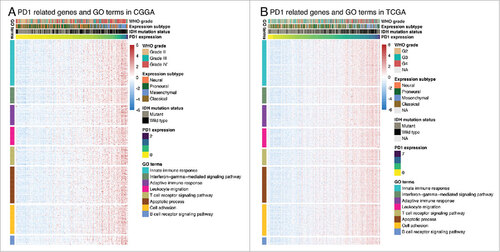
Figure 4. Association between PD-1 expression and immune cell populations in CGGA (A) and TCGA (B) datasets.
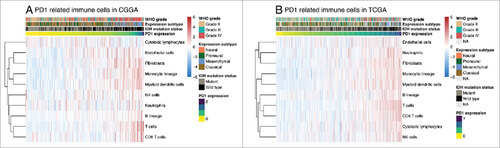
Figure 5. Correlation of PD-1 and immune related molecules.
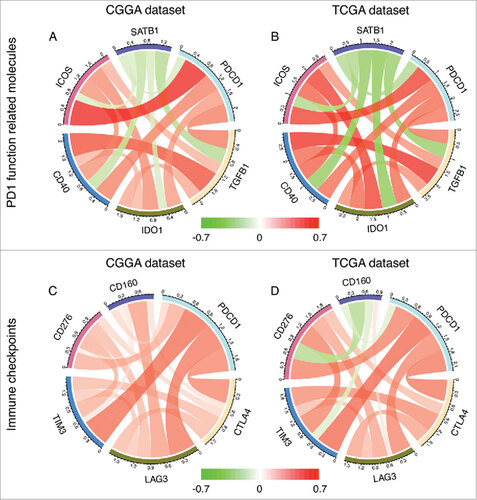
Figure 6. Survival differences of diffuse glioma and GBM patients with high and low PD-1 expression status in CGGA and TCGA datasets.
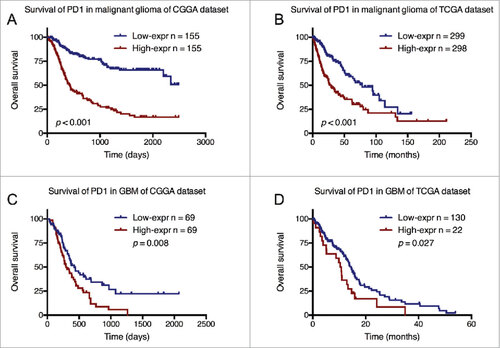
Table 1. Univariate and multivariate Cox analysis for factors potentially influence overall survival in CGGA and TCGA datasets.