Figures & data
Table 1. Characteristics of patients examined for the T cell response in tumor lesions and irAE lesions.
Figure 1. Development of pneumonitis during PD-1 blockade. (A, B) An FDG-positive pulmonary lesion of patient 1 (A) was resected and presented as organizing pnmeumonia in the histological examination (B). (C, D) An FDG-negative lesion in the same patient was resected (C) and a necrotic melanoma metastasis was found by histological analysis (D).
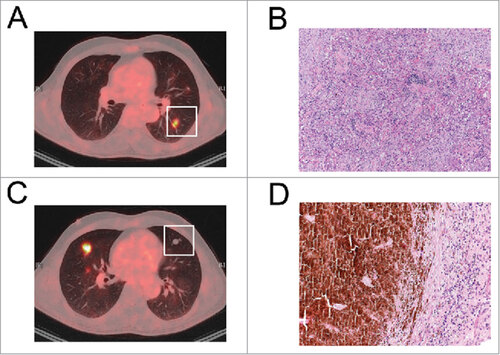
Figure 2. Histological analysis of tumor and irAE-infiltrating T cells. (A) Representative images of IHC analysis of the pulmonary irAE lesion from patient 1 for the indicated markers. (B) Quantification of CD3, CD4, and CD8 positive cells, ratios of CD4+ vs CD8+ and TIA1+ cells in tissue sections from the tumor and in the irAE lesions from patients 1 and 2. Numbers were calculated on.
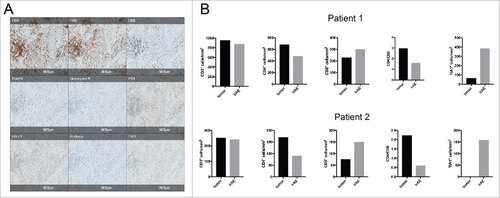
Table 2. Quantification of infiltrating immune cells in tumor and irAE lesions from patient 1 and 2.
Figure 3. Analysis of TCR repertoire in tumors and irAE lesions. (A) Next generation sequencing of the complementary determining region 3 (CDR3) of the beta chain of the TCR was performed. The prevalence (frequency of reads compared to all reads in percent) is compared between inflammatory lung tissue (irAE, y-axis) and the tumor from patient 1. (B) Post-mortem frequency of T cell clones found in different tissues from patient 2. The frequency in the tumor was compared to irAE lesions of the lung (left panel), meninges (middle panel), and the myocardium (right panel). (C, D) Frequency of T cell clones in patient 3 (C) and patient 4 (D). (E) Analysis of overlap of sequences between tumor lesions and pneumonitis lesions or PBMCs/lymph node (LN). The prevalence (frequency of reads compared to all reads in percent) is compared between inflammatory lung tissue (irAE, y-axis) and the tumor from patient 1 (left panel), patient 2 (middle panel) and all analyzed patients (right panel). Analysis by one-way ANOVA, # p < 0.05.
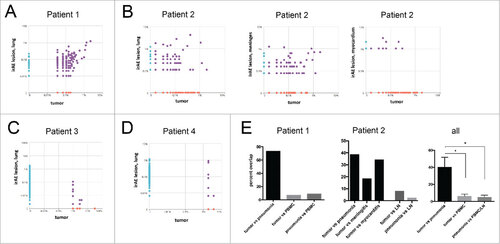
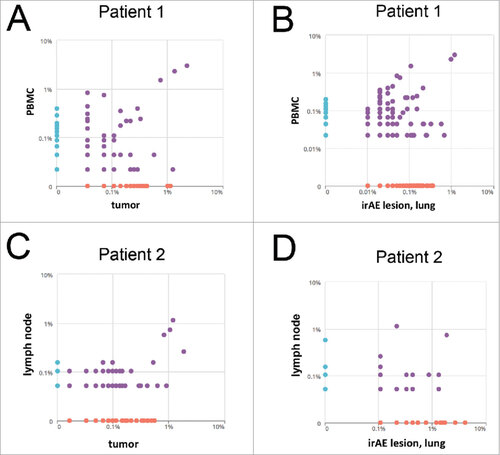
Figure 4. Frequency of tumor and irAE-infiltrating T cells in the peripheral blood. (A, B) Prevalence of T cell clones in peripheral blood compared to the metastasis (A) or pulmonary irAE lesion (B) in patient 1. (C, D) Frequency in percent of T cell clones in the lymph node compared to the frequency in the tumor (C) or the pulmonary lung lesion (D).