Figures & data
Figure 1. CD163 infiltrate in leiomyosarcoma. Representative images of primary leiomyosarcoma with low CD163 infiltrate (≤ 20%) (A) and high CD163 infiltrate (>20%) (B) using immunohistochemistry (scale bars 50 μm). The same pattern of CD163 infiltration was observed in the primary tumor and in the associated relapse/metastasis (C). Overall, 60% of leiomyosarcomas were highly infiltrated with CD163-positive cells, which strongly correlated with tumor grade (D). CD14-positive cells were differentiated for 6 days with GM-CSF or M-CSF as controls for M1 and M2 phenotype, respectively, and with leiomyosarcoma cells (LMS04, LMS05) using transwell or their conditioned media (CM). Expression of the surface marker CD163 (M2) on differentiated CD14-positive cells was analyzed by flow cytometry (E). Bars indicate relative geometric mean fluorescence intensity (MFI) ± standard error of mean (SEM) of three independent healthy donors, normalized to the M-CSF condition. Nonparametric Mann-Whitney test or the Kruskal-Wallis test followed by Dunn's post-test were used to compare differences between conditions. #p < 0.05. M-CSF measurement using a Luminex assay on LMS04 and LMS05 conditioned media (F). Results are expressed in pg/ml (n = 2).
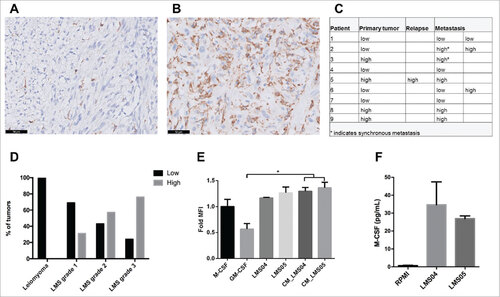
Table 1. Demographic and clinicopathological characteristics.
Table 2. Clinicopathological characteristics based on CD163, CD3 and PD-L1 expression.
Figure 2. Prognostic significance of CD163, CD3 and PD-L1 in leiomyosarcoma. Kaplan-Meier survival curves for overall survival (A, D, G), disease-specific survival (B, E, H) and disease-free survival (C, F, I) according to CD163 infiltration (low n = 27; high n = 48), CD3 infiltration (low n = 30; high n = 43) and PD-L1 expression (negative n = 46; positive n = 28) in primary leiomyosarcomas. A high CD163 infiltrate (> 20%) is associated with poor overall and disease specific survival. P-value obtained by log-rank test.
Figure 3. HLA class I expression in leiomyosarcoma. Representative staining patterns of β2-microglobulin, HLA-A (HCA2 antibody) and HLA-B/C (HC10 antibody) expression in smooth muscle cells from blood vessel, leiomyoma and leiomyosarcoma using immunohistochemistry. In general, basal low HLA class I expression was found on normal smooth muscle cells while frequently heterogeneous or strongly positive expression was seen in leiomyosarcomas, suggesting that HLA class I is upregulated in the majority of these tumors. Scale bars, 50 μm.
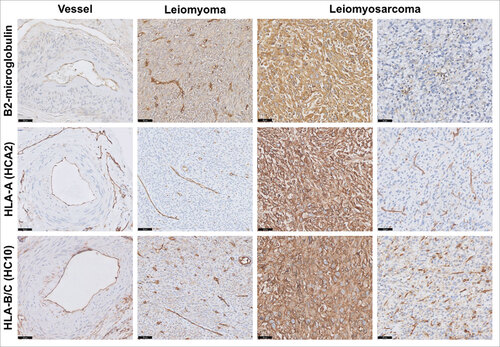
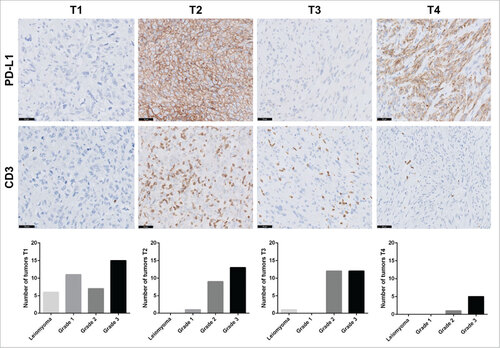
Figure 4. Tumor-infiltrating lymphocytes and PD-L1 expression in leiomyosarcoma categorized with the TIME classification. Representative images for PD-L1 and CD3 immunostaining in leiomyosarcoma patients. Scale bars, 50 μm. According to the TIME classification, 39 tumors exhibited the T1 subtype (TILs−, PD-L1−), 23 the T2 subtype (PD-L1+, TIL+), 25 the T3 subtype (PD-L1−, TIL+) and 6 the T4 subtype (PD-L1+, TIL−). Distribution of tumor grades within each subtype is represented by a bar chart.