Figures & data
Figure 1. Antigenic profile of exosomes. (A) Exosomes isolated from patients with MM were characterized by flow-cytometry for the expression of CD9, CD63 and CD81 resulting in most instances higher than 95%. (B) Representative panels by TEM showing cup-shaped Exo (arrows) with a mean size of 80 nm (range: 40–110 nm). (C-D) A similar level of expression (higher than 90% in all instances) of CD3 as well as CD80 and CD86 antigens was revealed in peripheral mononuclear cells (red histograms) and Exo (blue histograms) isolated from 10 randomly selected MM patients. Histograms are representative of a single MM patient (pt.#3). Grey histograms are IgG1 a isotypic controls.
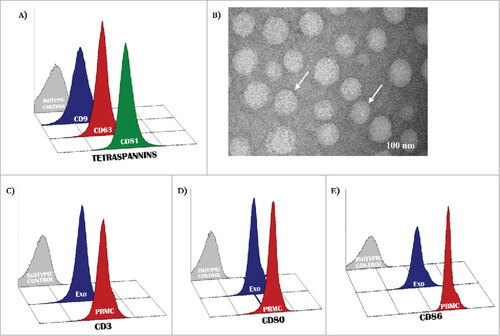
Figure 2. Expression of molecular immune checkpoints by T-Exo in MM population. (A) Levels of PD-1 (51.0±1.4%) and CD28 (62.6±3.0%) positive T-Exo were increased in groups A (p<0.0001) with respect to B (39.4±1.5% and 42.6±2.5%). By contrast, ICOS levels were almost similar. Bars are means±SEM (standard error of the mean). (B) Statistical analysis was completed to define the basal cut-off values of PD-1, CD28 and ICOS for exploring the meaning of their variation in MM population. As shown, the ROC curve analysis revealed a sensitivity and specificity equal to 79.5% and 86.7% for PD-1 (red line) while the values of CD28 (blue line) were 77.3% and 80%, respectively. A significant cut-off value for ICOS was not identified (yellow line). (C) Waterfall plots graphically represent the trend of PD-1 (up) and CD28 (down) levels with respect to basal cut-off in MM population treated with IPI. Green bars represent patients who achieved a response (CR, PR, SD) with respect to those showing PD (red bars). (D) The response of patients with high (n = 23) or low (n = 36) PD-1 and CD28 levels are represented. The 56.5% (n = 13) of patients with high PD-1 showed a clinical benefit as compared to only 5.5% of those with low levels (n = 2; p<0.0001). Similarly, 52% of patients with high CD28 levels showed a response (n = 12) with respect to the 8% (n = 3) characterized by low levels (p = 0.0004). Bars are percentage of patients divided in responders (red) and not-responders (blue).
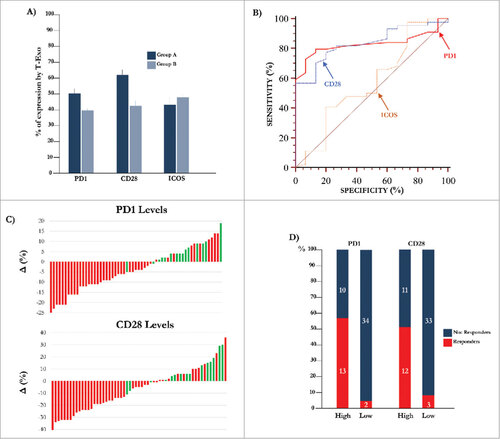
Table 1. Major prognostic criteria and mutational status in 59 MM patients enrolled in the study.
Figure 3. Kaplan-Meier curves for progression free survival and overall survival. (A) The Spearman's rank test revealed a positive correlation between PD-1 and CD28 levels of expression by T-Exo from MM population (rho: 0.459, p = 0.0003). (B) Median PFS and OS in MM population treated with IPI were 3.3 months and 8.5 months, respectively.
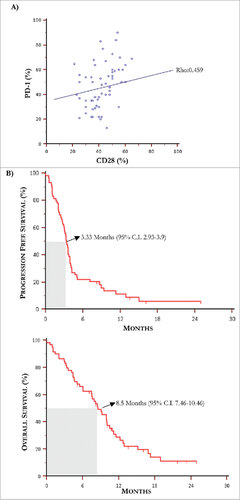
Table 2. One-way univariate analysis relative to molecular, pathological and laboratory parameters with respect to mean percentage levels of PD1 and CD28 by CD3+ Exo in MM population. TILs: tumor infiltrating lymphocytes; LDH: lactate dehydrogenase; ULN: upper limit of normal.
Figure 4. Kaplan-Meier curves by PD-1 and CD28 levels and predictive score. (A) Kaplan-Meier curves showing PFS (up) relative to PD-1 (left) and CD28 (right) levels in MM population. Patients with high basal PD-1 and CD28 T-Exo levels underwent increased PFS with respect to those with low expression of both receptors. The relative HR was 0.42 (95% C.I. 0.24-0.72) and 0.51 (95% C.I. 0.30-0.88), respectively (p < 0.05 in both instances). The OS (down) was similarly prolonged in patients bearing high basal PD-1 (HR:0.51, 95% C.I. 028-0.91) and CD28 (HR:0.48; 95% C.I. 0.27-0.86) expression (p < 0.05 in both instances). (B) PFS (left) and OS (right) calculated with respect to a predictive score calculated in relation to the basal values of PD-1 and CD28 higher or lower with respect to the cut-off. The study population was scored as follows: ‘0’ (n = 30; 50.8%), ‘1’ (n = 14; 23.7%), ‘2’ (n = 15; 25.4%). Median PFS and OS were 3.15 (95% CI: 2.03 to 3.57) and 6.06 months (95% CI: 4.1 to 9.9) in patients scored ‘0’, 3.56 (95% CI: 2.03 to 11.3) and 8.5 months (95% CI: 4.36 to 15.13) in those scored ‘1’ and 4.74 (95% CI, 3.33 to 15.00) and 10.93 months (95% CI, 10.0 to 12.9) in score ‘2’. Therefore, PFS (HR: 0.34, 95% C.I. 0.18-0.63; p = 0.0005) and OS (HR: 0.36, 95% C.I. 0.18- 0.71; p = 0.005) were significantly longer in score ‘2’ as compared to ‘0’, whereas a weak trend to significance in terms of median PFS occurred in ‘1’ (HR: 0.53, 95% C.I. 0.29-0.98; p = 0.041) with respect to ‘0’ without significant difference in terms of OS (p = 0.35). Finally, there was not significant difference in terms of PFS and OS between patients scored as ‘1’ or ‘2’. Score ‘2’: PD-1 hig/CD28 high; score ‘1’: PD-1 or CD28 high; score ‘0’: PD-1 and CD28 low. High and low levels were established in relation to values of ROC curves.
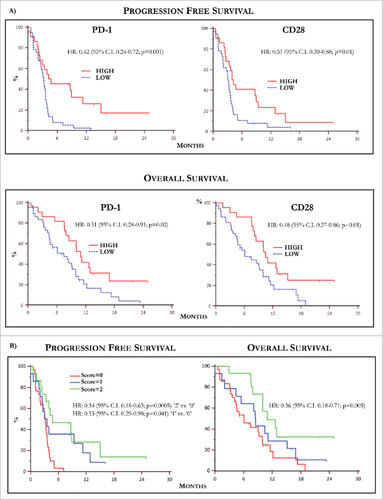
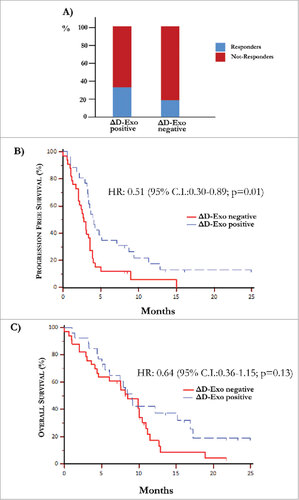
Figure 5. Over-expression of co-stimulatory molecules by D-Exo. (A) The difference of expression (Δ) of CD80 and CD86 levels by D-Exo before and after IPI was correlated to the clinical response. This linear correlation was confirmed at the end of treatment in 35% of patients with increased ΔD-Exo and, concurrently, only in 18% of those with decreased ΔD-Exo. Bars are percentage of patients showing ΔD-Exo positive (n = 26) and ΔD-Exo negative levels (n = 33) and include responders (blue) and not-responders (red). (B) Patients characterized by increased ΔD-Exo showed an improvement in terms of PFS (4.10 months vs 2.73 months) with respect to those with reduced ΔD-Exo with a HR of 0.51 (95% C.I. 0.30-0.89; p = 0.01). (C) Overall survival was independent by ΔD-Exo variation (HR: 0.64; 95% C.I. 0.36-1.15; p = 0.13).