Figures & data
Figure 1. Tumor formation induced by 4NQO. (A) 4NQO was administered 1 time a week for 16 consecutive weeks and then were given regular water until week 20. (B) Representative oral lesions in 4NQO-treated mice. (C) Representative Hematoxylineosin (HE) of 4NQO-treated mice and control mice. Most mice had one or more dysplastic lesions per tongue at week 16. All mice developed one or more large SCC per tongue at week 20.
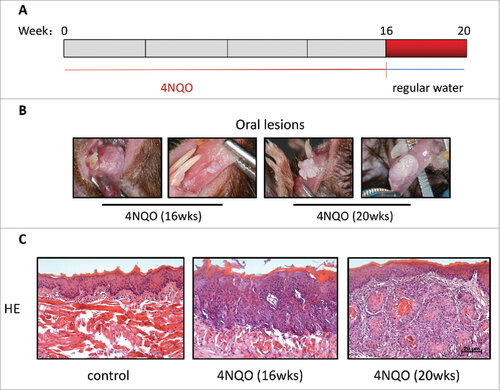
Figure 2. Upregulation of PD-1 in tumor-infiltrating lymphocytes in precancerous and cancerous oral lesions in 4NQO-treated mice at week 16. Representative tissue sections from the tongue of 4NQO-treated mice and control mice were analyzed for their expression of PD-1 by IHC. And blood was sampled from 4NQO treated-mice and control mice tails, then analyzed by flow cytometry. (A) Representative images show high expression of PD-1 in the 4NQO-treated mice group. (B) Representative results of flow cytometric staining of PD-1 expression on CD4+ T cells in peripheral blood from 4NQO-treated mice and control mice at 16 weeks revealed high expression of PD-1 on CD4+ T cells in the 4NQO-treated mice group. (C) Representative results of flow cytometric staining of PD-1 expression on CD8+ T cells in peripheral blood from 4NQO-treated and control mice at 16 weeks revealed high expression of PD-1 on CD8+ T cells in the 4NQO-treated mice group. All data represent average ± SD. Statistical significance was determined by Student t test, #p < 0.05, ##p < 0.01, ###p < 0.001.
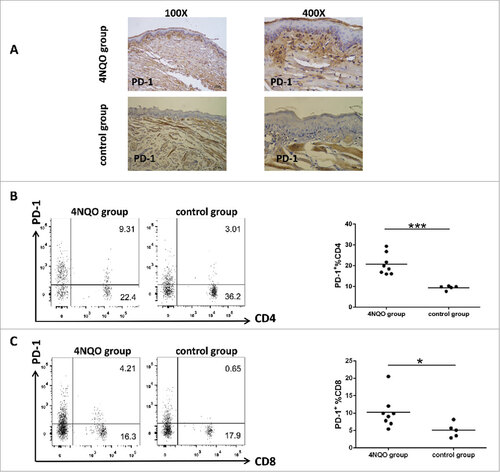
Table 1. Immunohistochemical analysis of the expression of PD-1 in tissue sections at week 16.
Figure 3. Anti-PD-1 mAbs treatment extends mice survival. (A) 4NQO was administered 1 time a week for 16 consecutive weeks. Anti-PD-1 mAb treatment was initiated at the end of the 4NQO exposure and was administered 1 time a week for 4 consecutive weeks. (B) Anti- PD-1 mAbs treated group and IgG control group were weighed and documented every 1 weeks. Body weights were significantly reduced at week 20 in IgG control group. The Student t test was performed for the significance determined, p = 0.0107. (C) Survival of IgG control group and anti-PD-1 mAbs treated group were monitored and showed. The survival curves were estimated using the Kaplan-Meier method. The log-rank test was performed for the significance determined, p = 0.0041.
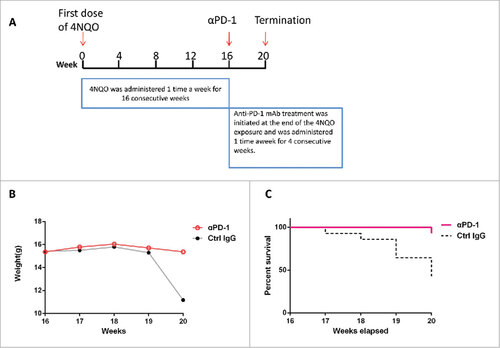
Figure 4. Anti-PD-1 mAb treatment inhibits tongue musoca lesions growth and delays carcinogenesis. (A) Photos of representative tongues of control IgG-treated and anti-PD-1 mAbs-treated mice. Anti-PD-1 mAbs-treated mice had decreased tongue musoca lesions. Data represent average ± SD. Statistical significance was determined by Student t test, ##p = 0.0015. (B) Representative Hematoxylineosin (HE) of dysplasias, preinvasive carcinoma (carcinoma in situ) and invasive carcinoma. Statistical significance was determined by Mann-Whitney U test, #p < 0.05. (C) The contrast of macroscopic observation of lingual mucosal lesion with anti-PD-1 antibodies or Hamster IgG antibodies. a and b, Reduction of lingual mucosal lesion with anti-PD-1 antibodies. c, No change of lingual mucosal lesion with anti-PD-1antibodies. Lesions appearing as leukoplakic lesion with smooth surface changed to rough, granular surface (d) or exogenous verrucous surface (e).
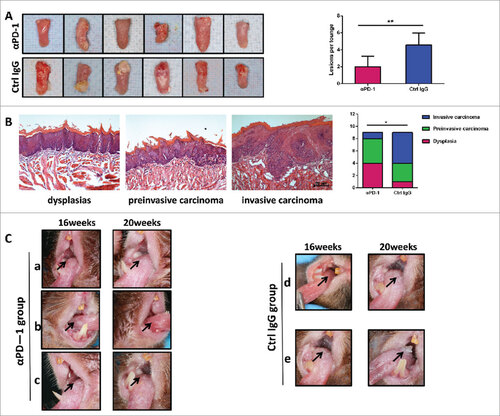
Figure 5. PD-1 antibody-treatment downregulates PD-1 expression but increase the accumulation of CD4+ T cells, CD8+ T cells. (A) Representative tissue sections from the tongue of anti-PD-1 mAb-treated mice and control mice were analyzed for their expression of PD-1 by immunohistochemical staining, which indicates descreased PD-1 expression in the lesions of anti-PD-1 mAb -treated group. (B) Representative tissue sections from the tongue of anti-PD-1mAb-treated and control mice were analyzed for CD3+ T cells expression by immunohistochemical staining, which shows increased infiltration of CD3+ T cells in the lesions of anti-PD-1 mAb -treated group. (C) MFI for PD-1 of lymphocytes in spleen, lymph node and blood are shown. (D) Representative flow cytometric analysis of PD-1 expression on CD4+ T cells in spleen, lymph node and blood of both anti-PD-1 mAb-treated and control group. The percentages of PD-1 expression on CD4+ T cells are shown. (E) Representative flow cytometric analysis of PD-1 expression on CD8+ T cells in spleen, lymph node and blood of both anti-PD-1 mAb-treated and control group. The percentages of PD-1 expression on CD8+ T cells are shown. (F, G) The percentages of CD4+ and CD8+ T cells in spleen, lymph node and periphery blood in anti-PD-1 mAb-treated and control IgG-treated mice are shown. All data represent average ± SD. Statistical significance was determined by Student t test, #p < 0.05, ##p < 0.01. MFI, mean fluorescence intensity.
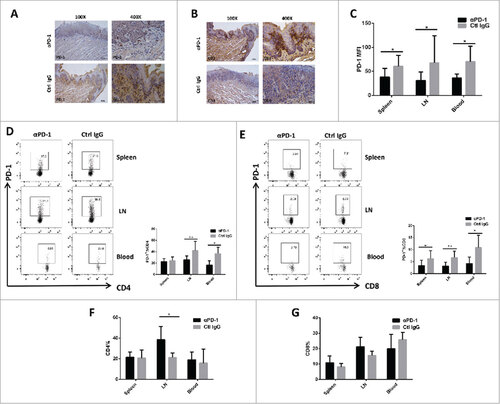
Table 2. Immunohistochemical analysis of the expression of PD-1 and CD3 in tissue sections.
Figure 6. Blocking of the PD-1/PD-L1 pathway results in decreased levels of MDSCs and enhanced IL-2 and IFN-γ secretion by CD4+ T cells and CD8+ T cells in anti-PD-1 mAb -treated group. (A) Representative flow cytometric analysis and the percentages of MDSCs in spleen, lymph node are shown. (B) Representative flow cytometric analysis and the percentages of CD4+ and CD8+ T cells secreting IFN-γin spleen, lymph node are shown. (C) Representative flow cytometric analysis and the percentages of CD4+ and CD8+ T cells expressing IL-2 in spleen, lymph node are shown. All data represent average ± SD. Statistical significance was determined by Student t test, #p < 0.05, ##p < 0.01, ###p < 0.001,####p < 0.0001.