Figures & data
Figure 1. Characterization of epithelial and EMT phenotype of individual cloned sublines derived from K-Ras -pancreatic cells. (A) Distribution of epithelial or mesenchymal phenotype of cloned sub-lines of HPDE-K-RasG12V from two independent experiments (n = 63 and n = 25). Each subline was evaluated for the expression of epithelial (high E-Cadherin, low vimentin) and mesenchymal markers (low E-Cadherin, high Vimentin) compared to Mock-transduced cells. (B) mRNA expression levels of TWIST, ZEB-2, SNAIL and SLUG analyzed by real time qPCR. (C) Expression of E-Cadherin protein by immunofluorescence using anti-human E-Cadherin antibody; nuclei are stained with DAPI. Scale bar = 50 μm. (D) Quantification of active K-Ras (bound to GTP) in epithelial and mesenchymal lines by the K-Ras-GTP pull down assay. Bars refer to band intensity.
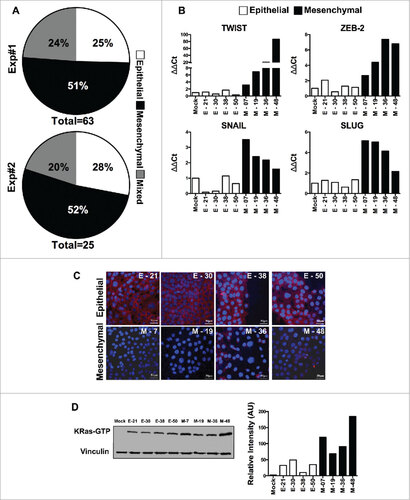
Figure 2. Characterization of epithelial and EMT functional features of individual cloned sublines derived from K-Ras -pancreatic cells. (A) Matrigel invasion assay of epithelial and EMT cell lines; shown are migrated cells (triplicates +/-SD) Student's t test #P<0.05. (B) Representative pictures of migrated cells in the lower membrane. (C) Tumor weight of different cell lines (5 × 10⁵) cells, grown in NSG mice, two-way ANOVA ##P< 0.01. (D) Incidence of liver metastasis after tumor cell injection (2 × 10⁶) in the spleen. (E) Representative (8 clones; 4 epithelial and 4 mesenchymal) images of liver metastasis (indicated by arrows) and histological sections of liver (H&E staining) to show metastatic nodules in the liver. Scale bar = 100 μm.
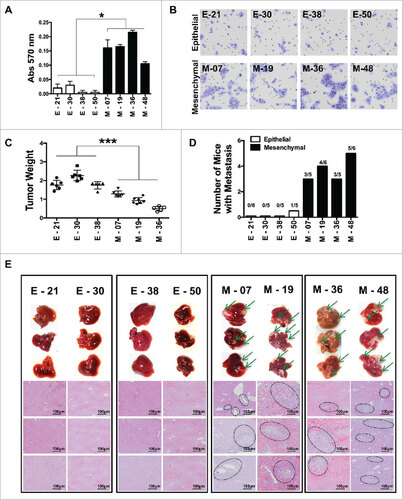
Figure 3. IL-1R antagonist reduces inflammation and tumor growth only in K-Ras-pancreatic cells with epithelial phenotype. (A) Constitutive secretion of inflammatory mediators (IL-6, CXCL8 and PTX3) in different epithelial and mesenchymal cell lines measured by ELISA. (B) Inhibition of inflammatory mediators in cell lines upon blocking IL-1 signaling with Anakinra (100 ng/ml). Mean +/-SD, 3 independent experiments, #P< 0.05. (C) Tumor growth (volume) in NSG mice of epithelial cell lines (E-21, E-30, E-38) and mesenchymal cell lines (M-7, M-19, M-36), treated (solid circle) or not (empty circles) with Anakinra (2 μg/mouse, three times/week), 5–7 mice for each group, two-way ANOVA ##P<0.01 (D) Representative immunohistochemistry image of CD31+ vessel network in tumor sections from untreated or Anakinra-treated mice and relative quantification. (E) Representative Immunohistochemistry pictures (F4/80, macrophages) in the same tumors sections. Scale bar = 100 μm. Images were captured with V20Dot Slide microscope and analyzed with image pro analysis software in D and E, bar graphs indicate the quantification of the specific immunoreactive area (Mean +/-SD of 5 sections/tumor, 3–5 tumors per group). Student's t test #P<0.05 ##P<0.01 ###P<0.001. ns: non-significant.
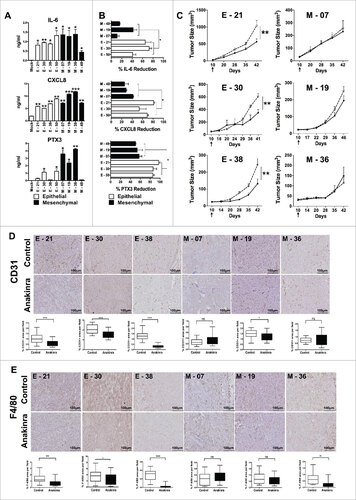
Figure 4. IL-1R antagonist reduces NF-κB p65 and STAT3 phosphorylation in only K-Raspancreatic tumors with epithelial phenotype. Representative immunohistochemistry image of tumors from epithelial cell lines (E-21, E-30, E-38) and mesenchymal cell lines (M-7, M-19, M-36) treated or not with Anakinra as detailed in the legend of . (A) NF-κB p65 phosphorylation, and (B) STAT3 phosphorylation (Tyr 705). Scale bar = 100 mm. Graphs at right side indicate quantification of stained area. Bars indicate mean +/-SD of 5 sections/tumor, 3–5 tumors per group). Student's t test #P<0.05, ##P<0.01, ###P<0.001. (C) mRNA expression level of inflammatory mediators in the tumor microenvironment by real-time qPCR. Bars, mean +/-SD. #P<0.05, ##P<0.01 for difference between control and Anakinra treated group.
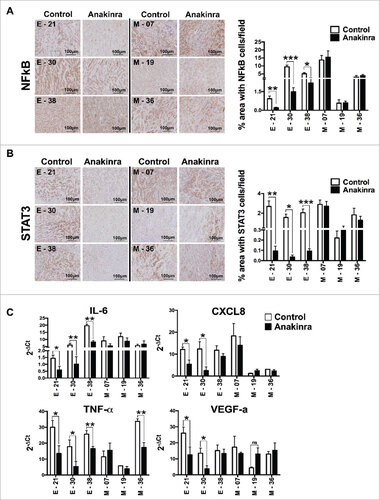
Figure 5. IL-6 is transcriptionally activated by TWIST in K-Ras-pancreatic cells with mesenchymal phenotype. mRNA expression levels of TWIST (A) or Zeb2 (B) upon shRNA silencing of each specific transcription factor in four mesenchymal pancreatic cell lines. Graphs in the middle and right panels show ELISA quantification of IL-6 and CXCL8 in silenced cells. Bars, +/-SD. #P<0.05, ##P< 0.01, ###P<0.005 (Student's t test). (C) ChIP assay to evaluate the recruitment of TWIST to the IL-6 promoter. H3K9Ac antibody was used as a marker of active chromatin, while rabbit IgG was used as negative control. Input and immunoprecipitated DNA were analyzed by qPCR using primers that span the proximal E-box of the IL-6 promoter. Results are mean +/-SD of one of two independent experiments with similar results, ###P<0.005 (Student's t test).
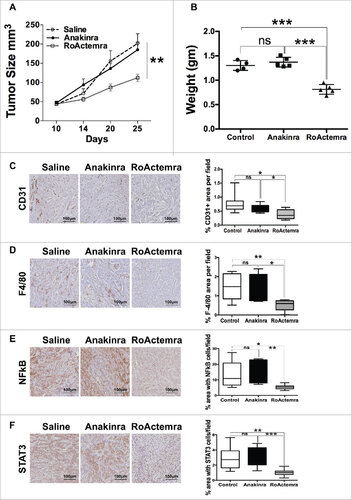
Figure 6. Anti-IL-6R mAb reduces inflammation and tumor growth in K-Ras -pancreatic cells with mesenchymal phenotype. Tumor growth (A) Tumor growth (volume) in NSG mice of mesenchymal cell lines (M-07), not treated (empty circle) or treated with Anakinra (solid circles) or with RoActemra (empty square), 2 μg/mouse, three times/week, 5–7 mice for each group, two-way ANOVA ##P<0.01. (B) Tumor weight (C) Representative Immunohistochemistry image of tumor sections with CD31 vessel network; (D) F4/80, macrophages; (E) NF-κB p65 phosphorylation; (F) STAT3 Tyr 705-phosphorylation. Image quantification was performed as detailed in and is shown in the right panels. #P<0.05, ##P< 0.01, ###P<0.005 (Student's t test).