Figures & data
Figure 1. Representative immunohistochemical stainings with the B2M-specific mAb L368 (panel A+D), the CD3-specific mAb PS1 (panel B+E) and the PDCD1 (PD-1)-specific mAb NAT105 (panel C+F). A Homogenous B2M expression in a B2M-wild type tumor (HD04). B Representative CD3-positive T cell expression in a B2M-wild type tumor. C Low amount of PDCD1 (PD-1)-positive T cells in a B2M-wild type tumor. D Absent B2M expression on the tumor cell surface in a B2M-mutant tumor (HD43). E Representative image of CD3-positive T cell infiltration in a B2M-mutant tumor. F B2M-mutant tumor, highly infiltrated with PDCD1 (PD-1)-positive T cells. Scale bars, 100 μm.
![Figure 1. Representative immunohistochemical stainings with the B2M-specific mAb L368 (panel A+D), the CD3-specific mAb PS1 (panel B+E) and the PDCD1 (PD-1)-specific mAb NAT105 (panel C+F). A Homogenous B2M expression in a B2M-wild type tumor (HD04). B Representative CD3-positive T cell expression in a B2M-wild type tumor. C Low amount of PDCD1 (PD-1)-positive T cells in a B2M-wild type tumor. D Absent B2M expression on the tumor cell surface in a B2M-mutant tumor (HD43). E Representative image of CD3-positive T cell infiltration in a B2M-mutant tumor. F B2M-mutant tumor, highly infiltrated with PDCD1 (PD-1)-positive T cells. Scale bars, 100 μm.](/cms/asset/11363885-4730-4ff0-9187-8ed3f6987ec3/koni_a_1390640_f0001_oc.jpg)
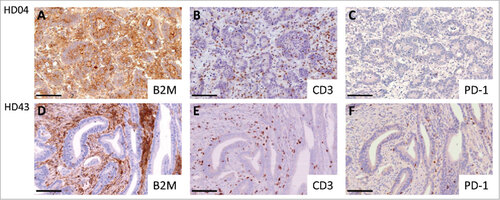
Table 1. Characteristics of MSI colorectal cancer patients.
Figure 2. Distribution of specific T cell infiltration data in B2M-mutant (mt) and B2M-wild type (wt) MSI colorectal cancers A There was no statistically significant difference in intratumoral CD3-positive T cell infiltration between B2M-mutant (mt) and B2M-wild type (wt) MSI colorectal cancers B A significantly higher number of PDCD1 (PD-1)-positive T cells was observed in B2M-mutant compared to B2M-wild type MSI colorectal cancers.
![Figure 2. Distribution of specific T cell infiltration data in B2M-mutant (mt) and B2M-wild type (wt) MSI colorectal cancers A There was no statistically significant difference in intratumoral CD3-positive T cell infiltration between B2M-mutant (mt) and B2M-wild type (wt) MSI colorectal cancers B A significantly higher number of PDCD1 (PD-1)-positive T cells was observed in B2M-mutant compared to B2M-wild type MSI colorectal cancers.](/cms/asset/961cfe2b-14a2-4207-92be-8787d78f069d/koni_a_1390640_f0002_b.gif)
Table 2. Multivariate logistic regression model for B2M mutation status.
Figure 3. Distribution of specific T cell infiltration data in tumors with HLA class II antigen expression status high, intermediate or lack of or barely detectable A We observed a significant increase in overall T cell infiltration in tumors with higher HLA class II antigen expression B PDCD1 (PD-1)-positive T cell infiltration tended to increase with higher HLA class II antigen expression, but the difference did not reach statistical significance.
![Figure 3. Distribution of specific T cell infiltration data in tumors with HLA class II antigen expression status high, intermediate or lack of or barely detectable A We observed a significant increase in overall T cell infiltration in tumors with higher HLA class II antigen expression B PDCD1 (PD-1)-positive T cell infiltration tended to increase with higher HLA class II antigen expression, but the difference did not reach statistical significance.](/cms/asset/1f9a071c-65af-4d2e-86bc-ae81d6d05d76/koni_a_1390640_f0003_b.gif)
Figure 4. Influence of PDCD1 (PD-1)-positive T cell infiltration on immune evasion in MSI colorectal cancer. A (left panel): Low levels of PDCD1 (PD-1)-positive T cells within the tumor microenvironment likely reflects a condition of less stringent immune selection, which allows the outgrowth of HLA class I antigen-positive, B2M-wild type cancer cells. B (right panel): Outgrowth of B2M-mutant cancer cells (blue), which lack HLA class I antigen expression, predominantly occurs in an activated local immune environment characterized by PDCD1 (PD-1)-positive T cell (red) infiltration. This observation supports the immunoediting concept in MSI colorectal cancers. If B2M mutations interfere with anti-PDCD1 (PD-1)/CD274 (PD-L1) therapy success, MSI cancers with high PDCD1 (PD-1)-positive T cell infiltration (right panel) may be resistant towards anti-PDCD1 (PD-1) antibody therapy due to lack of HLA class I antigen expression.
![Figure 4. Influence of PDCD1 (PD-1)-positive T cell infiltration on immune evasion in MSI colorectal cancer. A (left panel): Low levels of PDCD1 (PD-1)-positive T cells within the tumor microenvironment likely reflects a condition of less stringent immune selection, which allows the outgrowth of HLA class I antigen-positive, B2M-wild type cancer cells. B (right panel): Outgrowth of B2M-mutant cancer cells (blue), which lack HLA class I antigen expression, predominantly occurs in an activated local immune environment characterized by PDCD1 (PD-1)-positive T cell (red) infiltration. This observation supports the immunoediting concept in MSI colorectal cancers. If B2M mutations interfere with anti-PDCD1 (PD-1)/CD274 (PD-L1) therapy success, MSI cancers with high PDCD1 (PD-1)-positive T cell infiltration (right panel) may be resistant towards anti-PDCD1 (PD-1) antibody therapy due to lack of HLA class I antigen expression.](/cms/asset/227369ba-9dd4-409f-a077-4ad8054d292f/koni_a_1390640_f0004_oc.jpg)
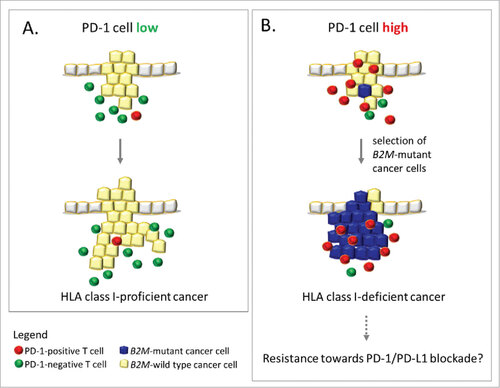
Table 3. Multivariate ordered logistic regression model for HLA class II antigen expression.