Figures & data
Figure 1. BCAN RNA expression on grade II, III astrocytoma, oligodendroglioma and ependymoma samples. (A) RNA counts using the Nanostring technology for the BCAN gene. Tumor samples are grouped by type and non-tumor control samples (8 epilepsy samples, 2 normal brains, 2 commercial RNAs) are shown on the right (ctrl). sGBM: secondary GBM. (B) Box plots analysis of expression of the BCAN gene on the different tumor groups showing the median, lower quartile (25th percentile) and upper quartile (75th percentile). The bars indicate the lower adjacent value and the upper adjacent value. Points indicate outliers. AII: grade II astrocytoma, AIII: grade III astrocytoma, ODII: grade II oligodendroglioma, ODIII: grade III oligodendroglioma, EP: ependymoma, sGBM: secondary GBM, ctrl: non-tumor samples. ##: p < 0.01, #: p < 0.05.

Figure 2. Antigen expression on grade II, III astrocytoma, oligodendroglioma and ependymoma samples and recurrent sample pairs. Box plots analysis of expression of the BCAN, CSPG4, PTPRZ1, TNC and SOX2 (A), FABP7 and IGF2BP3 (B), NLGN4X and NRCAM (C), IL13Rα2, gp100, Her2 and TRP2 (D) genes on the different tumor groups showing the median, lower quartile (25th percentile) and upper quartile (75th percentile). The bars indicate the lower adjacent value and the upper adjacent value. #: p < 0.05 versus non-tumor samples, ##: p < 0.01 versus non-tumor samples.. AII: grade II astrocytoma, AIII: grade III astrocytoma, ODII: grade II oligodendroglioma, ODIII: grade III oligodendroglioma, EP: ependymoma, sGBM: secondary GBM, ctrl: non-tumor samples. (E) mRNA counts for the IGF2BP3 gene in paired (pairs of 2, 3 or 4, each separated by a space) recurrent samples. AII➔AII: grade II astrocytoma recurring as grade II astrocytoma, AII➔AIII: grade II astrocytoma recurring as grade III astrocytoma, AII➔sGBM: grade II astrocytoma recurring as secondary GBM, AIII➔sGBM: grade III astrocytoma recurring as secondary GBM.
Figure 3. Proportion of positive samples for the tested antigens. Percentage of samples positive for BCAN, CSPG4, FABP7, IGF2BP3, NLGN4X, NRCAM, PTPRZ1, TNC, gp100, Her2, IL13Rα2, SOX2 and TRP2, determined as mRNA counts > mean mRNA counts for non-tumor samples + 2 standard deviations. AII: grade II astrocytoma, AIII: grade III astrocytoma, ODII: grade II oligodendroglioma, ODIII: grade III oligodendroglioma, EP: ependymoma, sGBM: secondary GBM, ctrl: non-tumor samples (hatched bars).
Figure 4. Expression of IMA950 antigens at the protein and peptide levels. (A) Representative IHC staining for the BCAN, CSPG4, FABP7 and IGF2BP3 proteins on grade II and III astrocytoma and secondary GBM (sGBM). Inserts show higher magnification. Bar scale: 100 μm (B) Percentage of positive tumors. (C) Presentation of the PTPRZ1195-203 peptide at the surface of normal samples including normal brain samples, grade II/III samples and GBM. Upper panel: Shown is the MS signal intensity, reflecting peptide presentation at the cell surface, including box plots analysis showing the median, lower quartile (25th percentile) and upper quartile (75th percentile). The box plot bars indicate the lower adjacent value and the upper adjacent value. Lower panel: peptide detection frequency on the tested tissues.
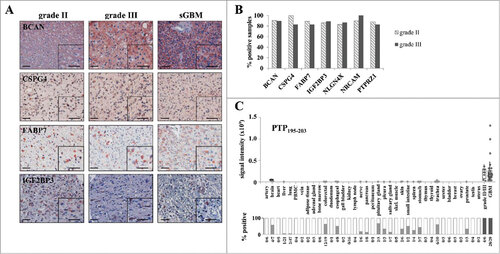
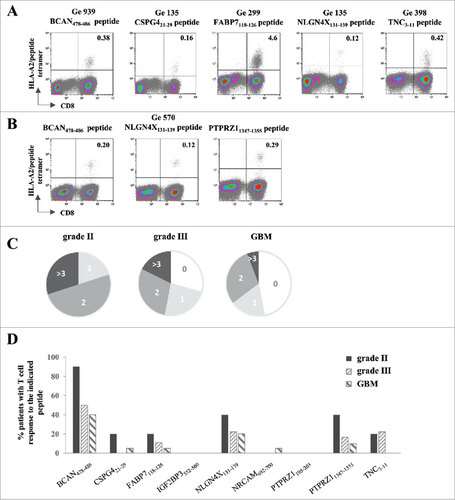
Figure 5. Spontaneous T cell responses to the IMA950 antigens are detected in patients with grade II/III tumors. (A) Representative examples of T cell responses in four different grade II/III astrocytoma (Ge 939, Ge 135, Ge 299)/oligodendroglioma (Ge 398) patients specific for 5 different antigens. The number of CD8+ HLA-A2/peptide tetramer+ T cells are shown in the upper right quadrant. (B) T cell responses towards 3 different antigens are shown for grade II astrocytoma patient Ge 570. The number of CD8+ HLA-A2/peptide tetramer+ T cells are shown in the upper right quadrant. (C) Proportion of grade II (n = 10) and III (n = 17) astrocytoma/oligodendroglioma and primary GBM (n = 17) patients with spontaneous T cell responses to 0, 1, 2, 3 or more antigens. (D) Pattern of spontaneous T cell responses in grade II, III astrocytoma and oligodendroglioma and primary GBM patients to the tested antigens.