Figures & data
Figure 1. Expression of CD47 on human/mouse glioma cell lines and GSCs. (A) Immunofluorescence analysis revealed that CD47 was expressed on all of the human/mouse glioma cell lines examined in the study (U87, U251, U138, U118, A172, and GL261). Human astrocytes (HA1800) and primary mouse astrocytes were used as the controls (scale bars, 20 µm). (B) CD47 expression was relatively higher for U138 and GL261 when assessed by western blot. (C) CD47 protein levels were also assessed in primary glioma stem cells and a purified CD133+ GSC population from GL261. (D) Representative flow cytometric plots and (E) histogram plots of CD47 expression. (F) CD47 mRNA levels were measured using quantitative PCR, showing that CD47 expression was higher in primary glioma tissue (p<0.0001) compared to adjacent non-tumor tissues. (G) Representative images of CD47-specific staining and EGFR in paraffin sections of primary samples. (H) High levels of CD47 mRNA expression correlated with decreased survival of patients (p = 0.0065).
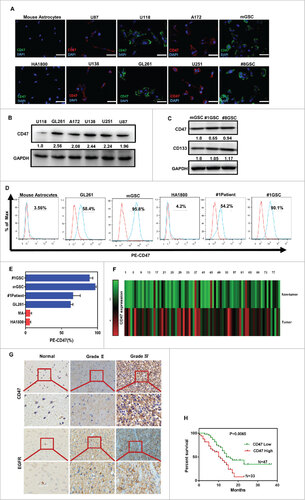
Table 1. Correlation between the clinicopathologic characteristics and expression of CD47 protein in glioma patients.
Figure 2. CD47+ glioma cells exhibit many of the features of cancer stem cells. (A) Using CCK-8 and (B) EdU assays, we demonstrated that the proliferative activities of CD47+ glioma cells were higher than CD47- cells (scale bars, 15 µm). (C) Representative images of tumor formation using primary glioma cells from Patient 1 and GL261 cells. (D) Paraffin-embedded immunohistochemical tumor tissue sections stained with H&E, PCNA, and CD47 (20× and 40× ) . (E) Expression of stem cell markers (Sox2, Oct4, and Nanog) measured using western blot. (F) Tumor sphere formation capacities of several cells lines (Scale bar represents 100 µm). (G) Transwell migration and (H) invasion assays demonstrating that CD47+ glioma cells were more migratory and invasive, compared to CD47- cells. #p<0.05, ##p<0.01. Data are presented as means ± SD.
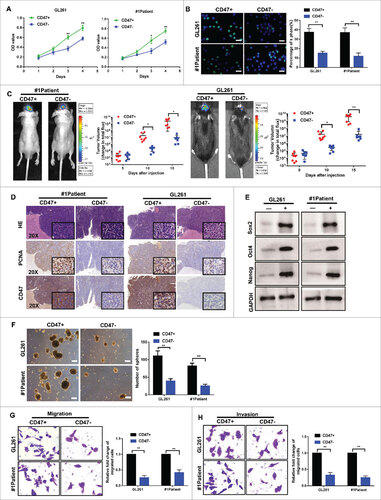
Figure 3. CD47 knockdown reduced stem/progenitor features of GSCs. (A) Analysis of CD47 mRNA and CD47 protein expression in cells transfected with a shCD47 (short hairpin RNA) lentiviral vector and controls. (B) CCK-8 assays and (C) EdU assays revealed growth was suppressed in CD47 knockdown cells (scale bars, 15 µm) (D) EdU assays were also conducted by the FACS. (E-F) Representative images of mice orthotopically injected with shCD47 cells or controls. (G) Tumor volumes were significantly decreased and survival times prolonged in shCD47 cells. (H) Paraffin-embedded immunohistochemical tumor tissue sections stained with H&E and PCNA (40× ) , PCNA expression also decreased in CD47 knockdown tumor tissues. (I) The size and number of spheres were lower in shCD47 cells (Scale bar,100 µm). (J) Migration and (K) invasion were also reduced in shCD47 cells. #p<0.05, ##p<0.01. Data are presented as means ± SD.
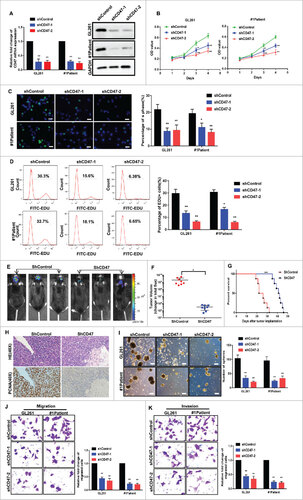
Figure 4. Anti-CD47 treatment increased phagocytosis of glioma cells and GSCs and was cytotoxic. (A) Representative images (left) and phagocytic indices (right) of macrophages phagocytosing labelled tumor cells following treatment with anti-CD47 antibody. CD47- glioma cells were used to avoid any aspecific effect of anti-CD47 antibodies. Arrows indicate phagocytosed tumor cells. (B) Phagocytosis assay were also conducted by flow cytometric (left) and histogram (right) plots. (C) LDH release assay was performed in glioma cells (left) and GSCs (right) at effector:target ratios of 5:1, 10:1, 20:1, and 30:1. (D) FACS analysis of apoptosis determined using an Annexin V/PI staining kit with glioma cells and GSCs. Data are presented as means ± SD, #p<0.05, ##p< 0.01, ###p<0.001.
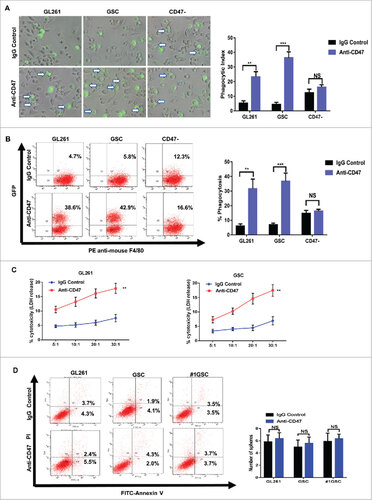
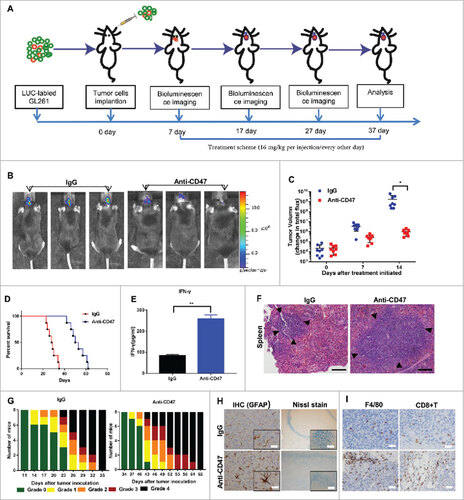
Figure 5a. Anti-CD47 mAb inhibited tumor growth in an immunocompetent syngeneic glioma cell/GSC model. (A, J) Treatment scheme of the GL261/GSC-implanted mice. (B, K) Representative BLI images and (C, L) measurements of tumor volume. (D, M) Anti-CD47 treatment significantly prolonged survival time. (E, N) The production of IFN-γ was detected in peripheral blood by ELISA. (F, O) H&E staining of spleen tissue showed a marked expansion in the germinal centers of the anti-CD47 treatment groups (scale bars, 100 µm). (G, P) Tumor-induced neurological deficit symptoms over time. The grading scheme used was grade 0, healthy mice; grade 1, slight unilateral paralysis; grade 2, moderate unilateral paralysis and/or the beginning of a hunched back; grade 3, severe unilateral or bilateral paralysis and pronounced a hunched back; grade 4, moribund and/or dead mice. (H, Q) Immunohistochemistry of tumors sections stained with Nissl stain and anti-GFAP antibody showing no visible damage to neurons and astrocytes in the anti-CD47 mAb groups (scale bars, 50 µm). (I, R) Immunohistochemistry of tumors sections stained with F4/80 macrophage and CD8+ T cell specific antibodies demonstrating increased infiltration at the tumor site (scale bars, 50 µm).
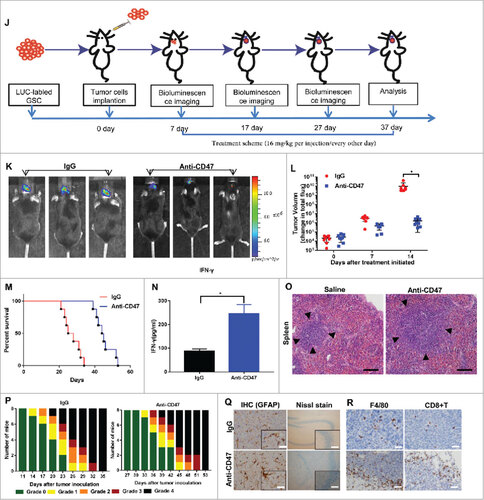
Figure 5b. (Continued)