Figures & data
Figure 1. Identification of immune-related subtypes of HNSCCs in TCGA cohort. (A) The cumulative distribution function (CDF) curves in consensus cluster analysis. CDF curves of consensus scores by different subtype number (k = 2, 3, 4, 5, 6) were represented. (B) The consensus score matrix of all samples when k = 4. A higher consensus score between two samples indicates they are more likely to be grouped into the same cluster in different iterations. (C) Two-dimensional scaling plot by expression profile of global immune genes. Each point represents a single sample, with different colors indicating the four subtypes. (D) Venn diagram of the overlapping of genes across four subtypes. The upregulated genes for each subtype were calculated by unpaired t-test, with FDR < 0.01 and fold change > 2 as the cutoff. (E) Gene expression profile of the top 100 featured genes which were specifically upregulated in each subtype. Heat map indicates relative gene expression value, with yellow for high expression and cyan for low expression.
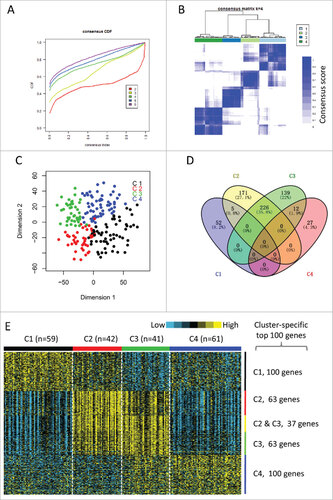
Table 1. Association of four molecular subtypes with clinical parameters in TCGA cohort.
Figure 2. Immune profiles of the four subtypes in TCGA cohort. (A) The gene expression scores of 24 immune signatures across four subtypes are displayed in the upper panel. The lower panel indicates the expression profile of costimulatory/coinhibitory molecules. Heat map indicates relative gene expression value, with yellow for high expression and cyan for low expression. (B) The expression scores of signatures of six immune cells in four HNSCC subtypes. Boxplots indicate 5%, 25%, 50%, 75%, and 95%, respectively. Comparisons between subtypes were performed by Student's t-test. All p values were corrected by the Bonferroni method. The adjusted value of p < 0.05 was considered significant.
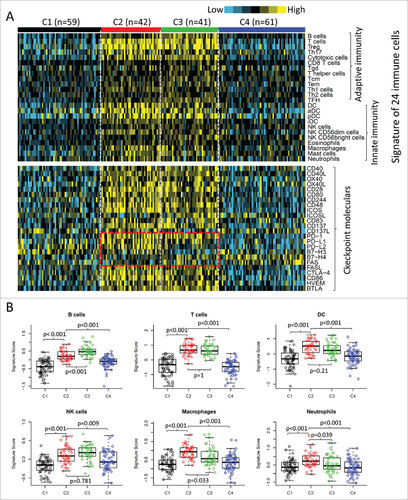
Figure 3. Differential expression of checkpoint molecules in HNSCC subtypes in TCGA cohort. The gene expression value of eight checkpoint molecules were presented across four subtypes. Boxplots indicate 5%, 25%, 50%, 75%, and 95%, respectively. Comparisons between subtypes were performed by Student t-test. All p values were corrected by the Bonferroni method. The adjusted value of p < 0.05 was considered significant.
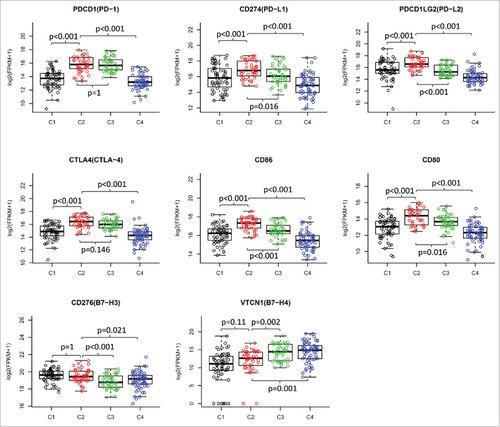
Figure 4. Validation of the four immune-related subtypes in the LHNG cohort. (A) Gene expression profile of the top 100 featured genes in the LHNG cohort. The subtypes (columns) were assigned by the centroids of TCGA cohort. Heat map indicates relative gene expression value, with yellow for high expression and cyan for low expression. B and C. The expression value of immune signatures (B) and checkpoint molecules (C) among subtypes in the LHNG cohort. Boxplots indicate 5%, 25%, 50%, 75%, and 95%, respectively. Comparisons between subtypes were performed by Student's t-test. Multiple testing was corrected by the Bonferroni method. The adjusted value of p < 0.05 was considered significant.
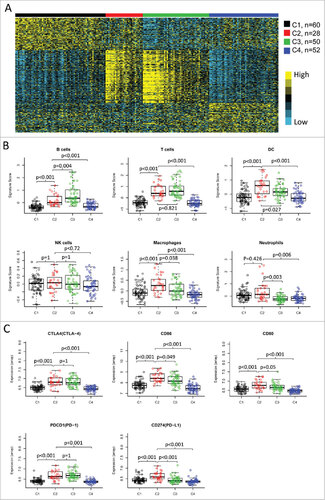
Table 2. Association of four molecular subtypes with clinical parameters in the LHNG cohort.
Figure 5. Expression pattern of non-immune stromal cell signatures and inflammatory chemokine signature. The MCP-counter score of endothelial cells (left column) and fibroblasts (middle column), and the expression value of chemokine signature (right column) were presented across four HNSCC subtypes. The data of TCGA cohort (upper row) and the LHNG cohort (lower row) was shown respectively. Boxplots indicate 5%, 25%, 50%, 75%, and 95%, respectively. Comparisons between subtypes were performed by Student t-test. All p values were corrected by the Bonferroni method. The adjusted value of p < 0.05 was considered significant.
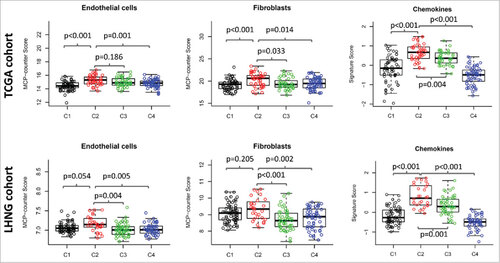
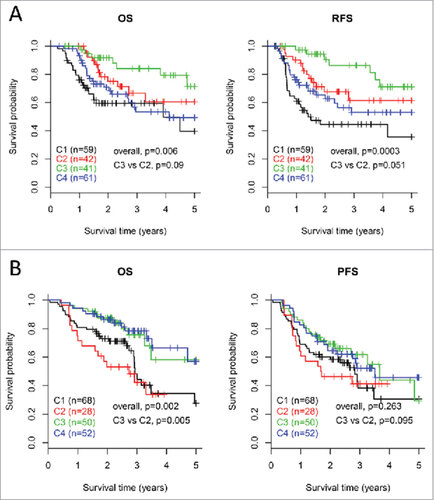
Figure 6. Survival analysis for the four subtypes of HNSCCs. Kaplan-Meier curves show the distinct outcome of patients in the four subtypes respectively. The p value was calculated by the log-rank test, by comparing the overall four subtypes together or subtype C3 versus subtype C2 only. Results are represented for TCGA cohort (A) and the LHNG cohort (B), respectively.