
Figures & data
Table 1. Patients' characteristics.
Table 2. Pathological characteristics.
Figure 1. Pathway of the immune cell quantification. IHC: immunohistochemistry.
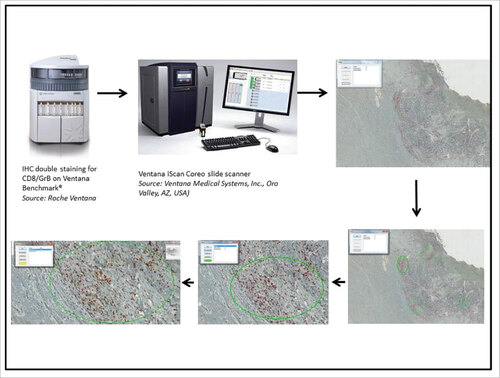
Table 3. Immune cell infiltrate.
Figure 2. Boxplots of CD3+/CD8+ in tumor stroma (A) and in tumor epithel (B); Data distribution of CD8+/GrzB+ and CD8+ cells in tumor stroma (C) and tumor epithel (D). CD: cluster of differentiation; GrzB: granzyme B.
Table 4. Differences of immune expression in preoperative biopsy and tumor.
Table 5. Survival analysis.
Table 6. Tumor regression grade (TRG) system according to (6).
Supplemental material