Figures & data
Figure 1. Sushi-IL15-Apo bioactivity (A) IL-15 activity upon stimulation of IL-15Rα-expressing and non-expressing responding cells, measured as cell proliferation. CTLL2 and Moe7 cells were labeled with tritiated thymidine and treated with different concentrations of IL-15 or Apo-IL15-Sushi. Nuclear incorporation of tritiated thymidine was measured at 48 h. (B) STAT-5 phosphorylation in CD8+ and NK cells as induced by IL-15 and Apo-IL15-Sushi. pSTAT-5 was stained and its expression studied by flow cytometry. PBMCs from volunteers were incubated with different concentrations of IL-15 or Sushi-IL15-Apo at 37ºC during 30 min. Histograms show pSTAT-5 expression in cells treated with 10 nM of Sushi-IL15-Apo (black) or 10 nM of IL-15 (red). The grey shadow histograms correspond to the non- stimulated cells.
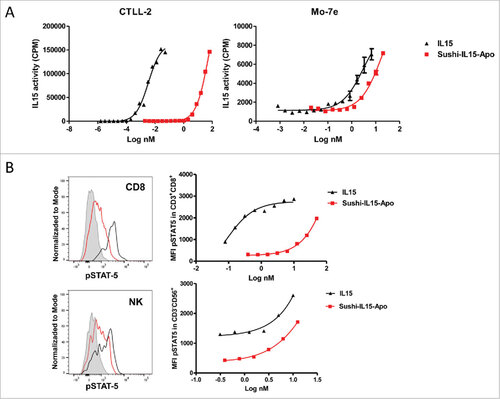
Figure 2. Sushi-IL15-Apo i.v. administration increases NK and CD8+ T cell populations in mice. Mice received i.v. 20 µg of Sushi-IL15-Apo protein. After five days, lymphocyte populations from spleens (A) and livers (B) were studied. # = p < 0.05 and ## = p < 0.01 in a student t test.
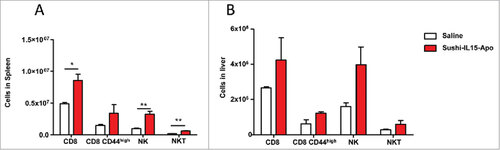
Figure 3. Sushi-IL15-Apo increases absolute numbers of human NK cells in culture and increases their survival and proliferation. (A) PBMCs from volunteers were cultured without cytokines or with 10 nM of Sushi-IL15-Apo. At 72h cells were counted and CD3−CD56+ percentages determined by flow cytometry. (B) Purified NK cells were pre-stained with CFSE and cultured without cytokines or with 10 nM of Sushi-IL15-Apo or IL15 during 72 h and proliferation was monitored by flow cytometry. (C and D) NK cells from volunteers were isolated using a negative selection immunomagnetic kit and cells were cultured without cytokines or with 10 nM of Sushi-IL15-Apo for 6 days. The indicated markers were studied by flow cytometry. Each dot represents the result in individual subjects. (E) Surface CD137 expression was studied by flow cytometry on purified NK cultured as in B and C. Furthermore, RNA was isolated and CD137 expression analyzed by real time RT-PCR. # = p < 0.05, ## = p < 0.01 and ### = p < 0.001 in a paired student t test.
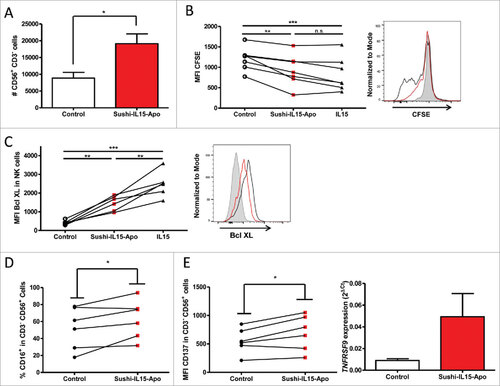
Figure 4. Sushi-IL15-Apo increases NK-cell mediated ADCC and natural cytotoxicity in vitro (A) Purified NK cells that had been cultured for 48h with Sushi-IL15-Apo or without cytokines were subsequently cocultured with cells from the colon carcinoma derived cell line HT-29 previously labeled with chromiun51 in the presence or absence of cetuximab. % specific cytotoxicity was measured in 4 h chromium release assays. Right top panel: CD107a expression on NK cell membranes after isolation, activation as in A and coculture with HT-29 cells in the presence or absence of cetuximab. Right bottom panel: Percentage of dead or apoptotic tumor cells. (B) Intra-cellular expression of granzyme B in NK cells cultured for 48 h with 10 nM of Sushi-IL15-Apo. (C and D) Percentage of CD107a+ NK cells and dead and apoptotic tumor cells were determined in a flow cytometry assay as in A, but using the HER2+ cell line BT474 with trastuzumab (C) or the CD38+ multiple myeloma-derived cell line MM1S with daratumumab (D) to stimulate the cultures. (E) NK cells treated as in A were cocultured for 4 h with chromiun51 labeled K562 cells to study % of cytotoxicity in chromium release assays. ###< p0.001, ## = p < 0.01 and # = p < 0.05 in a two-way ANOVA test comparing the Sushi-IL15-Apo + cetuximab group vs. cetuximab group in A or Sushi-IL15-Apo vs. control in C.
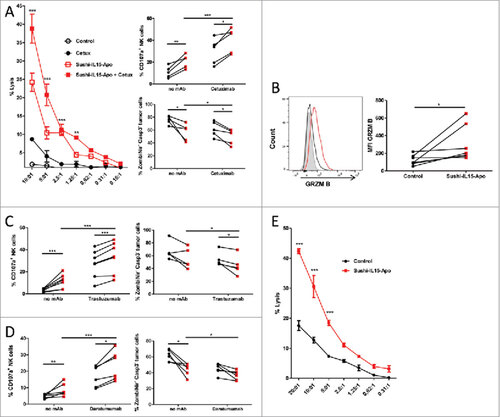
Figure 5. Sushi-IL15-Apo binds to SR-B1 on tumor cells and IL-15 is trans-presented to CD8T and NK cells (A) SRB1 membrane expression on different tumor cell lines as measured as the mean of fluorescence intensity by flow cytometry. (B) STAT5 phosphorylation in NK and CD8+ T cells cocultured with tumor cells that had been previously incubated with 50 nM of Sushi-IL15-Apo protein and washed three times. (C) STAT5 phosphorylation in NK cells treated as in B, but with a group in which SR-B1 was blocked by a specific antibody. The positive control was STAT5 phosphorylation in NK cells directly treated with 50 nM of Sushi-IL15-Apo. (D) STAT5 phosphorylation in NK cells incubated with Hela and MM1S washed three times after 30 min incubation with 100 nM of Sushi-IL15-Apo testing different dilutions of an anti-SR-B1 blocking antibody.
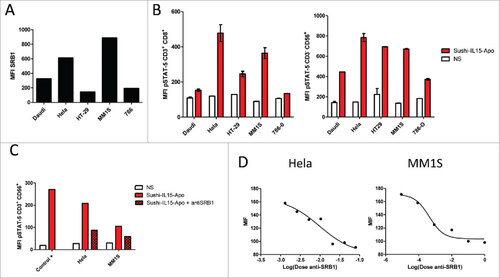
Figure 6. Sushi-IL15-Apo increases ADCC in a transient humanized murine model. (A) Absolute numbers of living HT-29 cells recovered from the peritoneal lavage of mice intraperitoneally given 106 HT-29 cells and 106 human PBMCs, 20 µg of Sushi-IL15-Apo protein and 50 µg of cetuximab. Pooled data from 4 independent experiments with 2–5 mice per group are shown in the graph. (B) Percentage of living HT-29 cells recovered in experiment A. (C) Absolute numbers of NK cells recovered in the peritoneal lavages. (D) Subcutaneous tumor growth observed in mice from the experiment A at the tumor lavage puncture site. (E and F) CD137 expression and percentage of CD16low cells in NK cells recovered in the peritoneal lavages. ## = p < 0.01 and # = p < 0.05 in U-Mann Whitney or Kruskal-Wallis test.
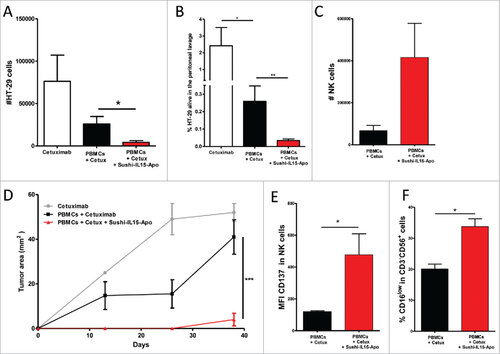
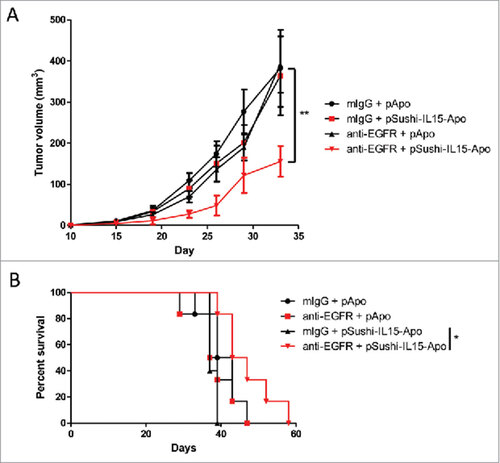
Figure 7. Sushi-IL15-Apo increases the anti-tumor effect of an anti-EGFR mAb in a subcutaneous syngeneic model. (A) Volume follow-up of subcutaneous tumors derived from MC38 colon cancer expressing EGFR treated with an anti-EGFR murine antibody or control and 1 µg of expression plasmid coding for Sushi-IL15-Apo that was hydrodynamically injected. ## indicates p<0.01 in a repeated measured ANOVA test comparing the tumor sizes between the group receiving anti-EGFR + pApo and the group treated with anti-EGFR and pSushi-IL15-Apo. (B) Kaplan-Meier survival curves. #indicates p<0.01 in a Gehan-Breslow-Wilcoxon test comparing the tumor sizes between the group receiving anti-EGFR + pApo and the group treated with anti-EGFR and pSushi-IL15-Apo.