Figures & data
Figure 1. Expansion of monocyte and granulocyte populations with B cell lymphoma progression. (A) Gating strategy for identifying granulocytes, Ly6Chi and Ly6Clo monocytes. (B) Numbers of granulocytes, monocytes, Ly6Chi monocytes and Ly6Clo monocytes from blood of day 12 Eµ-myc tumor-bearing mice versus healthy (naïve) mice. (C) Numbers of Ly6Chi and Ly6Clo monocytes in the blood of Eµ-myc tumor-bearing mice over time. Right panel – Ly6Chi and Ly6Clo monocytes expressed as a percentage of all CD115+ monocytes. (D) Correlations between granulocytes / Ly6Chi monocytes / Ly6Clo monocytes and B cells in Eµ-myc transgenic mice. (## p < 0.01 ### p < 0.001)
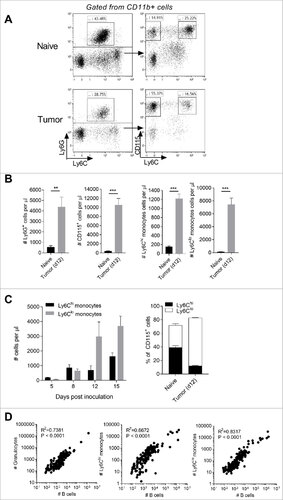
Figure 2. Myeloid cell depletions and monocyte conversion in lymphoma-bearing mice.(A-C) Eµ-myc tumor-bearing mice were given anti-Ly6G mAb or control mAb (c-Ig) treatments i.p. on days 5, 8, 11 and 14 to deplete granulocytes and monitored over time for granulocyte levels and tumor burden in the blood, and survival. (D-F) Eµ-myc tumor-bearing mice were administered clodronate-containing liposomes (Clod Lipo) or control PBS liposomes (PBS Lipo) i.v. on days 2 and 9 and the numbers of circulating macrophages (Macs), monocyte subsets and granulocytes (Grans) were assessed on day 12 (D). Tumor levels in blood (E), and survival (F) were monitored. Ly6Chi and Ly6Clo monocytes were isolated from blood of Eµ-myc tumor-bearing CD45.1+ mice at day 12 and adoptively transferred into either healthy (G) or Eµ-myc tumor-bearing (H) CD45.2+ hosts. Data shows recovery transferred monocytes at 48 hours in blood as a percentage of total CD11b+ myeloid cells (granulocytes excluded) – left panels, and the proportions of Ly6Chi and Ly6Clo monocytes within the transferred population – right panels. (# p < 0.05; ## p <0.01; ### p < 0.001; n = 5 per group)
Figure 3. Monocyte expression of immunosuppressive genes and PD-L1 surface protein levels. (A) Top 20 genes showing largest fold-differences between Ly6Clo – Ly6Chi cells from Eµ-myc 4242 (transplanted) tumor-bearing mice in descending order, and equivalent comparisons in Eµ-myc transgenic (spontaneous) tumor-bearing mice and healthy (naïve) mice. DESeq count normalization was applied to NanoString nCounter count data and the normalized expression data is plotted as a heat map along a relative z-scale (average values of each row is normalized to zero). The colour scheme of the heat map ranges from the minimum and maximum values within each row/gene and represented as a colour gradient from blue to red. (B-C) qRT-PCR assessment of immunosuppressive genes (relative expression) in Ly6Chi and Ly6Clo monocytes from Eµ-myc tumor-bearing mice (n = 4 biological replicates for each group). (D) Representative histograms of PD-L1 expression on monocyte subsets, compared to isotype control antibody staining (as indicated). Graphs show percentages (left panel) and mean fluorescence intensity (MFI) (right panel) of surface PD-L1 expression. (E) Numbers of PD-L1+ Ly6Chi and Ly6Clo monocytes (day 12). (# p < 0.05; ## p < 0.01).
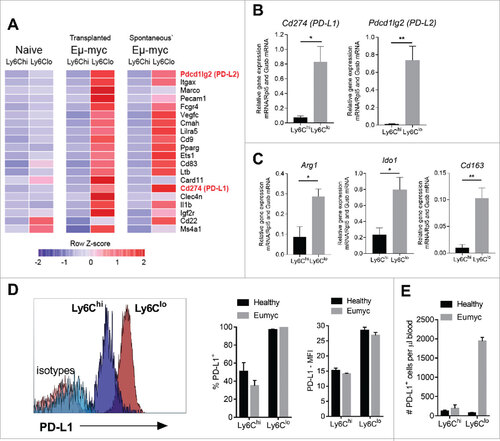
Figure 4. Immunosuppressive activity of monocyte subsets against CD8 T cells. (A) CD8 T cell proliferation shown as division index, with or without 3 days stimulation with CD3/CD28 beads and co-culture with tumor-derived Ly6Chi or Ly6Clo monocytes at the indicated monocyte to CD8 T cell ratios. Histograms show representative proliferation (CTV dye dilution) of CD8 T cells cultured in presence of absence of monocytes. (B/C) Percent suppression of CD8 T cell proliferation by Ly6Chi and Ly6Clo monocytes derived from healthy (naïve) or Eµ-myc tumor-bearing mice at 1 monocyte : 1 T cell ratio. (D) Percent suppression of PD-1 positive and PD-1 negative CD8 T cell proliferation in the presence of tumor-derived Ly6Chi and Ly6Clo monocytes at 1:1 ratio. (# p < 0.05; ## p < 0.01; n = 5 per group).
Figure 5. Mechanisms of monocyte immunosuppressive activity. Purified CD8 T cells were stimulated for 3 days with CD3/CD28 beads in the presence or absence of tumor-derived Ly6Chi and Ly6Clo monocytes co-cultured at 1:1 ratio in physical contact, or separated by transwells. CD8 T cell proliferation (A) and IFN-γ production (B) is shown and the percent suppression induced is indicated on the right. (C/D) Percentage of CD8 T cells dividing when co-cultured with the indicated tumor-derived monocyte subsets at 1:1 ratio, in the presence of absence of IDO inhibitor (1-MT) or Arginase inhibitor (nor-NOHA). (#p < 0.05; ### p < 0.001; n = 4 per group)
Figure 6. Depletion of Ly6Clo monocytes with liposomal doxorubicin and anti-4-1BB antibody. (A) Numbers of circulating Ly6Chi and Ly6Clo monocytes in healthy or day 12 Eµ-myc tumor-bearing mice after treatment with Doxil (Dox-Lipo) i.v. on days 2 and 9, and/or anti-4-1BB mAb i.p. on days 5 and 12. (B) Tumor burden in the blood over time following the indicated treatments, and (C) numbers of tumor cells in blood at day 12. (D) Numbers of circulating Ly6Chi and Ly6Clo monocytes in tumor-bearing mice on day 15. (E) Survival of Eµ-myc tumor-bearing mice receiving the indicated treatments. (# p < 0.05; ## p < 0.01; ### p < 0.001; n = 5 per group).
Figure 7. Immunosuppressive activity of CD14+HLA-DRlo monocytes from DLBCL patients. (A) CD8 T cell proliferation after 3 days stimulation of healthy donor (n = 8) or DLBCL patient (n = 6) PBMC with anti-CD3/CD28/4-1BB beads, with or without depletion of CD14+ monocytes. (B) Correlation of DLBCL patient CD14+ monocyte counts within the PBMC fraction versus the percentage increase in CD8 T cell proliferation after CD14+ monocyte depletion. (C) Proliferation of purified CD8 T cells from healthy donor PBMC (n = 18) following stimulation for 3 days with anti-CD3/CD28/4-1BB beads and co-culture with CD14+HLA-DRlo monocytes isolated from DLBCL patients PBMC, at the indicated ratios. (#p < 0.05; ## p < 0.01; ### p < 0.001)