Figures & data
Table 1. Classification of human colorectal cancer cell lines according to oncogenic mutational status and microsatellite stability.
Figure 1. Spheroid characterization. (A) Dot-Plot of a representative spheroid control showing the percentage of viable cells after 4 days (Ann-V−/AAD−) for the three cell lines. PS exposure on plasma membrane (annexin-V) and membrane permeabilization (7AAD) were analysed by flow cytometry as described in Material and Methods. (B) CRC spheroid area evolution in control group shows tumour progression in absence of treatment along the study time course. (C) Monocellular suspensions from 2D or 3D cultures were analysed by flow cytometry for the expression of HLA-ABC, ICAM-1 and PD-L1. Bar charts represent the Mean Fluorescence Intensity in 2D (white) and 3D (black) conditions. Histograms show a representative determination for HCT116 cell line. The dotted line corresponds to isotype control, the black line to 2D conditions and the grey line to 3D conditions. Data in the graphics are represented as the mean±SEM of at least 5 independent experiments where duplicate measures were determined as described in Materials and Methods. n.s. no statistically significance or #p<0.05, ##p<0.01, ###p<0.001 statistically significance was analysed by t-test.
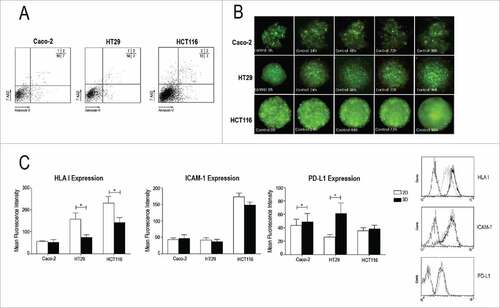
Figure 2. Apoptosis induced by R69-LCL activated NK cells on 2D and 3D HCT116 cell cultures. NK cells were enriched by MACS from fresh PBMC or after activation for 5 days with R69-LCLs (aNK). Subsequently they were incubated with Caco-2, HT29 and HCT116 cells seeded in monolayers for 4 hours (A) or spheroids for 48.hours (B) at low (up to 3:1) or high (between 6:1 and 9:1) e:t ratios. PS exposure on plasma membrane (annexin-V) and membrane permeabilization (7AAD) were analysed by flow cytometry as described in Materials and Methods. Results are presented as mean +/− SEM SEM of at least 3 independent donors
Figure 3. Cytotoxic effect of NK R69-LCL activated cells on HCT116 spheroid compared with naïve NK cells at high e:t ratio. (A, B and C) Fluorescent images of HCT116 cells (green) and NK cells (red) in a high e:t ratio during 96 hours treatment. Area evolution of CRC spheroids after treatment with nNK (A), activated NK cells (B), and control group with no NK presence (C). (D,E) A representative experiment from at least three experiments performed with 3 different donors is shown. The relative spheroid area was measured (D) Naïve nNK cells were able to reduce partially the tumour size but after 72h, spheroids star to grow and no clear effect is observed after 96h. (E) Activated NK cells at high e:t ratio are able to diminish drastically CRC spheroid size until almost complete elimination of GFP signal expressed by CRC cells.
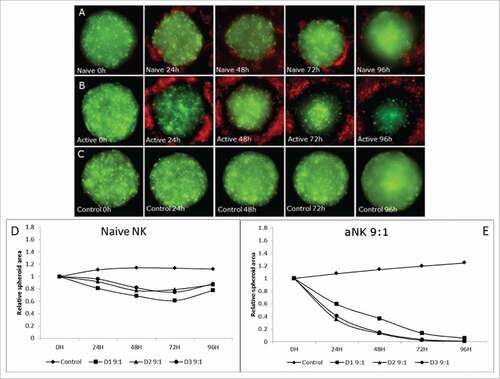
Figure 4. The e:t Ratio determines the cytotoxic effect of activated NK cells. A representative experiment from at least three experiments performed with 3 different donors is shown (A, B, C and D) Fluorescent images of HCT116 cells (green) and NK cells (red) in different e:t ratio after 96 hours of co-culture. (E, F and G) Relative area progression of the spheroids after treatment with different e:t ratio of activated NK cells from 3 different donors. (B and E) correspond to a 3:1 ratio of activated NK cells, (C and F) shows results obtained from the treatment of NK cells at a 6:1 ratio. (D and G) describe the 9:1 ratio activated aNK cell cytotoxic response.
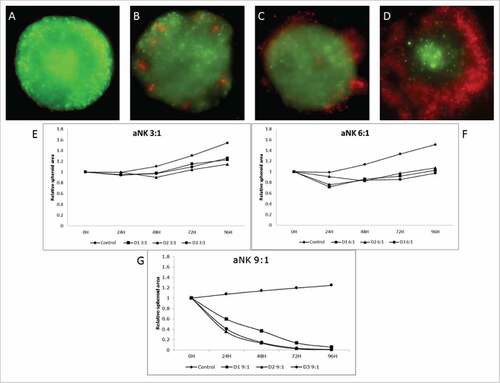
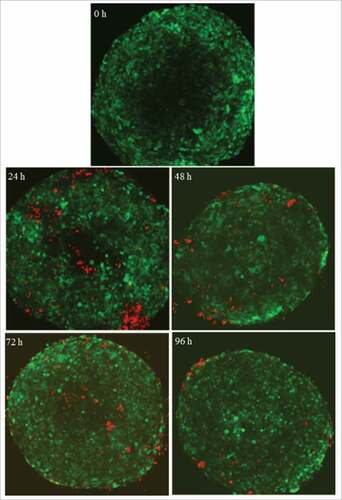
Figure 5. activated NK cells infiltrate the tumor spheroid at low e:t ratios. Time lapse of the central layers of CRC spheroids (green) obtained by confocal microscopy during the aNK (red) in vitro co-culture at 3:1 e:t ratio. After 24h in co-culture, aNK cells are able to infiltrate the tumor spheroid. This infiltration is observed till the 4th day in which NK cells tend to migrate towards the periphery.