Figures & data
Figure 1. Overexpression of CD47 in human HNSCC confers poor prognosis of HNSCC patients. Representative hematoxylin-eosin, immunohistochemical staining (A) and quantification (B) of CD47 in human head neck squamous cell carcinoma (HNSCC, n = 165) as compared with dysplasia (Dys, n = 48) and oral mucosa (n = 43). Each dot is presented as an independent core. CD47 staining was significantly alternated in different pathological grades (C, Grade II+III vs Grade I, P<0.05), the primary tumor with positive or negative lymph node metastasis status (D, N1+N2 vs N0, P<0.05). (E) Kaplan–Meier survival analysis indicated that high CD47 expression confers poor overall survival in the patient with HNSCC (P-value = 0.0495) with the median of CD47 protein expression histoscore (the histoscore = 58.37) as a cut-off.
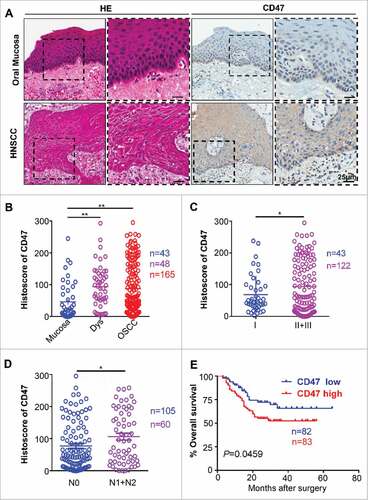
Figure 2. Overexpression of CD47 in human HNSCC is associated with inhibitory checkpoints and suppressive immune cell. (A) Representative immunohistochemical staining of CD47, PD-1, PD-L1, Foxp3, CD11b and CD33 in human HNSCC specimens. Scale bar, 25 μm. (B) The expression of CD47 was positively correlated with PD-1 (P<0.001, r = 0.2715) and PD-L1 (P <0.01, r = 0.2527). (C) The expression of CD47 were positively correlated with Foxp3 (P<0.001, r = 0.2857), CD11b (P<0.01, r = 0.2424) and CD33 (P<0.01, r = 0.2154) in human HNSCC. (D) Hierarchical clustering indicated a close relation of CD47 with PD-1 in primary HNSCC. (statistic including 165 primary HNSCC).
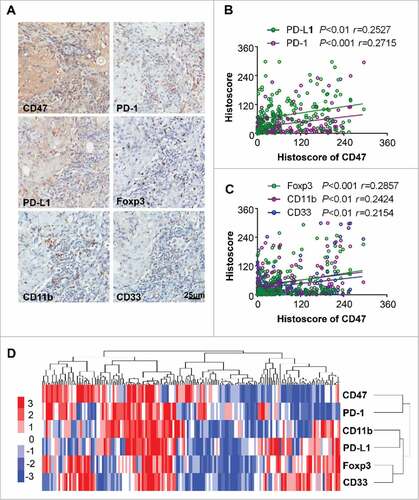
Figure 3. Anti-CD47 treatment by monoclonal antibody delays tumorigenesis in immunocompetent transgenic HNSCC mouse models. Representative immunohistochemical staining (A), western blot with GAPDH as a loading control of CD47 (B) and immunofluorescence staining for CD47 (red immunofluorescene), CK14 (green) and nucleus (blue) (C) in Tgfbr1/Pten 2cKO mice HNSCC compared with wild-type tongue. (D) Tgfbr1/Pten 2cKO mice bearing carcinoma by tamoxifen were treated with the CD47 antibody (αCD47) intraperitoneally (i.p) every other day for 28 days or isotype control treated (n = 5 mice respectively). (E) Tumor burden and representative photos of mice with head and neck tumor (right panel) after treatment with αCD47 or isotype IgG in day 18 and day 32 after tamoxifen gavage. Data presented as mean ± SEM.
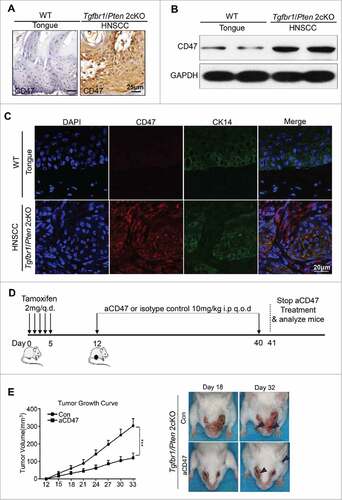
Figure 4. Anti-CD47 treatment improved effector T cell function in Tgfbr1/Pten 2 cKO mouse HNSCC model. After 4 weeks of anti-CD47 treatment (day 41), the mice were euthanized for further studies. (n = 5 mice respectively) (A) Representative flow cytometry and (B) quantification of CD47 blockade significantly decrease PD-1 expression in CD4+ and CD8+ T cell in aCD47 treated mouse HNSCC. (C) Representative flow cytometry and quantification of the percentage of IFN-γ+CD8+T cells in total CD8+T cells from mice tumor (Mean ± SEM. Unpaired t-test,##P-value<0.01). (D) Representative immunohistochemical staining of PD-1 and IFN-γ in mouse HNSCC.
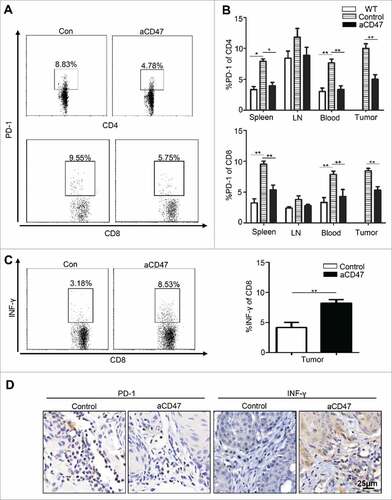
Figure 5. Anti-CD47 treatment significantly attenuated Tregs and MDSCs in Tgfbr1/Pten2 cKO mouse. (A) On the 41st day, the mice were euthanized for flow analysis. (n = 5 mice respectively) Representative flow cytometry plots of gating strategy of CD4+CD25+ Foxp3+Tregs in the spleen. (B) Quantification of Tregs from spleen, lymph nodes (LN), peripheral blood and tumor (Mean ± SEM. Unpaired t test, P< 0.05). (C) Immunohistochemical staining of Foxp3 in aCD47 treated mouse HNSCC as compared with isotype IgG treated counterpart. (D) Representative flow cytometry plots of gating strategy of CD11b+Ly6G+ and CD11b+Ly6C+ MDSCs in lymph nodes. (E) Quantification of MDSCs (Ly6G and Ly6 C) from spleen, lymph nodes (LN), peripheral blood and tumor (Mean ± SEM. Unpaired t-test, #P< 0.05, ##P< 0.01). (F) Representative immunofluorescence of CD11b+Gr1+MDSCs in Tgfbr1/Pten2 cKO mouse HNSCC in aCD47 group and isotype control group.
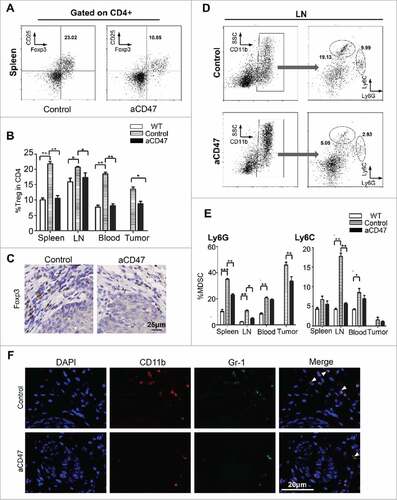
Figure 6. Anti-CD47 treatment regulates CD11b+ Ly6G+ MDSC function of HNSCC mouse model. (A) Representative FACS histogram of CFSE staining of activated T cells after cocultured with CD11b+Ly6G+Ly6Clo MDSCs in 72 hours. (B) Quantification of the suppressive activity of CD11b+Ly6G+Ly6Clo MDSCs between the anti-CD47 treated group and control group (NC, negative control; PC, positive control: No MDSC or Treg). (C) Representative FACS histogram of CFSE staining of activated T cells after cocultured with CD11b+Ly6G−Ly6Chi MDSCs in 72 hours. (D) Quantification of the suppressive activity of CD11b+Ly6G−Ly6Chi MDSCs between the anti-CD47 treated group and control group. (E) Representative FACS histogram of CFSE staining of activated T cells after cocultured with CD4+CD25hi Treg cells in 72 hours. (F) Quantification of the suppressive activity of CD4+CD25hi Treg between the anti-CD47 treated group and control group. (###P< 0.001; NS: no significant).
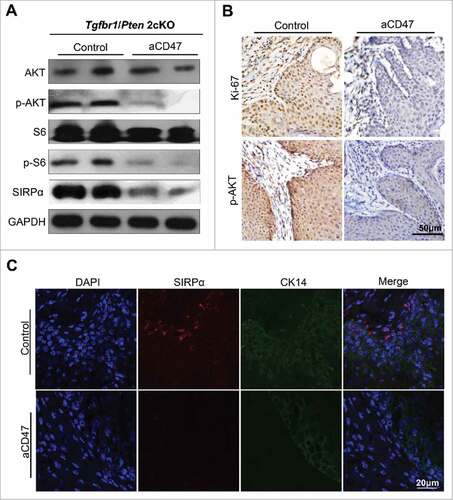
Figure 7. Anti-CD47 treatment influenced proliferation and may influence Akt-dependent pathway. (A) Western blot for AKT, p-AKT, S6, p-S6 and SIRPα in aCD47 group and isotype control group with GAPDH as a loading control. (B) Representative immunohistochemical staining of Ki-67 and p-AKT and (C) immunofluorescence staining of SIRPα in aCD47 group and isotype control group.