Figures & data
Figure 1. CD71 is expressed on MOC1 cells and endothelial cells within the tumor microenvironment. A, MOC1 cells were assayed for CD71 expression by flow cytometry (clone R17217; left panel) or immunofluorescence (right panel). B, MOC1 tumors were harvested, sectioned, and assessed for CD71 expression via immunofluorescence (40x image, H&E on left). C, MOC1 tumor or oral mucosa was harvested, digested into a single cell suspension and assessed for CD71 expression on CD45.2−CD31− epithelial/tumor cells, CD45.2+CD31− immune cells or CD45.2−CD31+ endothelial cells via flow cytometry. Representative dot plots of the digested tissues on the left, with representative CD71 histograms and quantification (MFI, n = 5 mice) on the right for each cell type. **, p < 0.01; ***, P,0.001.
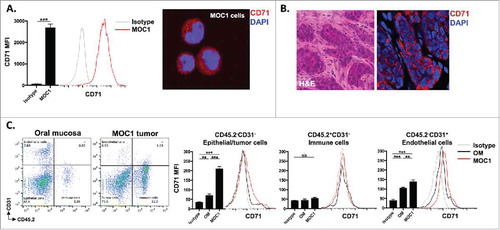
Figure 2. Treatment of MOC1 cells with scL-53 results in a functional TP53 protein that induces loss of cell viability, apoptosis and immunogenic cell death. A, MOC1 cells were exposed to 10 ng of scL-53 or scL-empty for 4 hours (volume equivalents), then incubated without treatment for 24 hours and assayed for human TP53 (clone DO-1) or mouse TP53 (clone 197643) expression by western blot. Lysates from human UMSCC46 cells served as a positive control for human TP53. B, expression of TP53 target genes p21, PUMA and NOXA was assessed via qRT-PCR following treatment with scL-empty or scL-53 as in A. C, cell viability was measured via XTT assay following treatment with increasing doses of scL-53 (exposed to scL-53 for 4 hours, then incubated without scL for 48 hours, indicated doses are per 1 × 10⁴ cells). D, expression of the apoptotic marker annexin V and 7AAD uptake was measured via flow cytometry 48 hours after a 4 hour treatment with scL-empty or 10 ng or 50 ng scL-53. E, to assess for induction of immunogenic cell death, cell surface calreticulin (flow cytometry, clone EPR3924), HMGB1 release (ELISA) and ATP release (bioluminescence assay) was assessed in MOC1 cells treated as in A (scL-53 dose of 10 ng) . For experiments in C-E, all indicated doses are quantity of plasmid per 1 × 10⁴ cells. All data are representative results from one of at least two independent experiments with similar results. **, p < 0.01; ***, P,0.001.
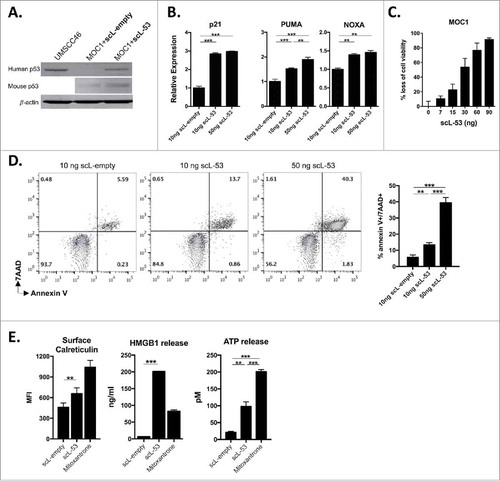
Figure 3. Treatment of MOC1 cells with scL-53 induces expression of type I IFN-dependent and independent immunogenicity. A, MOC1 cells were exposed to 10 ng scL-empty or scL-53 per 1 × 10⁴ cells for 4 hours then incubated without scL for 24 hours in the presence or absence of an IFNαR mAb (clone MAR1-5A3), and expression of antigen processing machinery was assessed via qRT-PCR. B, similarly treated MOC1 cells were assessed for expression of cell surface components of immunogenicity via flow cytometry. For some targets known to be IFN-inducible, cells treated with IFNβ (500 units/ml for 24 hours) were used as a positive control. C, MOC1 cells were treated with scL-53 (10 ng), nanocomplex containing a noncoding DNA payload (scL-vec, 10 ng) or scL-empty as in A, then stained for intracellular IFNβ via flow cytometry. D, MOC1 cells treated as in C were assayed for expression of cell surface components of immunogenicity. *, p < 0.05; **, p < 0.01; ***, P,0.001.
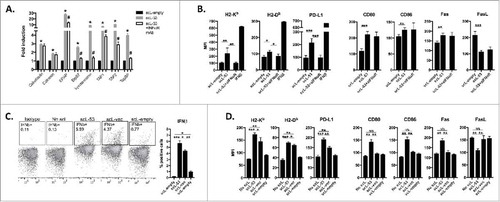
Figure 4. Induction of IFN-dependent immunogenicity following scL-53 treatment is STING dependent. A, MOC1 cells were treated with scL loaded with TMEM173 siRNA (100 ng nucleic acid per 1 × 10⁴ cells) or scL-empty (volume equivalent) for 4 hours and then incubated for 24 hours. TMEM173 protein expression was assessed via intracellular flow cytometry. B, following treatment as in A, MOC1 cells were treated with 20 μM R,R-CDA synthetic cyclic dinucleotide for 24 hours and IFNβ production was assayed by intracellular flow cytometry. C, following treatment as in A, MOC1 cells were treated with either scL-53 or scL-vec for 4 hours, then incubated for 24 hours. IFNβ production was assayed by intracellular flow cytometry. D, following treatment as in A, MOC1 cells were treated with either scL-53 or scL-vec for 4 hours, then incubated for 24 hours. Expression of cell surface components of immunogenicity was assayed via flow cytometry. **, p < 0.01; ***, P,0.001.
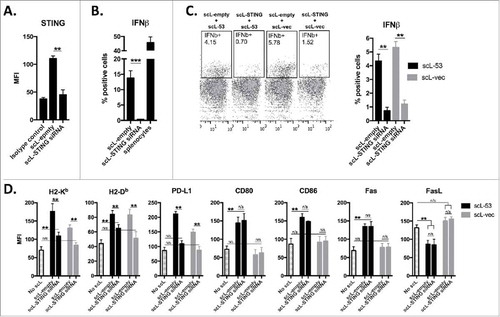
Figure 5. PD-1 mAb further enhances CTL lysis of engineered antigen-positive MOC1 cells following treatment with scL-53. A, to evaluate if scL-53 treatment enhances antigen presentation and antigen-specific CTL lysis, we performed experiments with MOC1 cells engineered to express full-length ovalbumin as a defined model antigen. SIINFEKL presentation via H2-Kb on the surface of MOC1ova cells was assessed via flow cytometry after treatment with scL-empty or scL-53 (10 ng per 1 × 10⁴ cells for 4 hours then incubated for 24 hours; representative histograms on left, quantification on right). B, CTL-mediated lysis of MOC1ova cells following scL-53 treatment as in A was measured using a standard CR51-release assay, (SIINFEKL pulsed untreated EL-4 cells used as a positive control). C, PD-1 expression was assessed via flow cytometry on the surface of SIINFEKL-specific CTLs generated from OT-1 splenocytes. D, CTL-mediated lysis of MOC1ova cells following treatment with scL-53, scL-vec or scL-empty as in A with or without PD-1 mAb (clone RMP1-14, 1 μg/mL) or isotype control (rat IgG2 Ab) was measured using a real-time impedance-based cytotoxicity assay. OT-1 CTLs were added at the indicated vertical black line. scL treatment times indicated by grey shaded box. Conditional growth curves shown on left, quantification 24 hours after the addition of the CTLs on the right (vertical dashed line). Quantification of loss of cell index quantified on right. All data are representative results from one of at least three independent experiments. **, p < 0.01; ***, P,0.001.
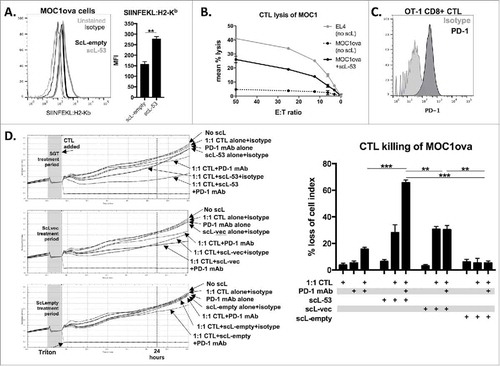
Figure 6. scL-53 treatment alone in vivo modestly alters MOC1 tumor growth but enhances tumor cell immunogenicity and effector immune cell tumor infiltration. A, established MOC1 tumors (WT B6 mice) were treated with scL-53 and digested whole tumors were assayed for the expression of human TP53 (clone DO-1) via western blot. B, treatment of established MOC1 tumors with single agent scL-53 (30 μg/injection, twice weekly x 3 weeks) resulted in a modest primary tumor growth delay (upper panel) and modest but statistically significant enhancement of survival (lower panel). Expression of MOC1 tumor cell (CD45.2−CD31−) surface components of immunogenicity (C, MFI shown) and tumor immune infiltration (D, absolute number of cells per 1 × 10⁴ live cells collected) were assessed following treatment of established MOC1 tumors via flow cytometry. Identified CD45.2+ cells included CD8 TIL (CD3+CD8+), CD4 TIL (CD3+CD4+), dendritic cells (CD11c+CD11b+/−PDCA+/−), macrophages (CD11b+F4/80+), gMDSC (CD11b+Ly6G+Ly6Cint) and mMDSC (CD11b+Ly6G−Ly6Chi). Shown are representative results from one of two independent in vivo experiments. Control mice for these experiments received TVI of PBS alone. *, p < 0.05; **, p < 0.01.
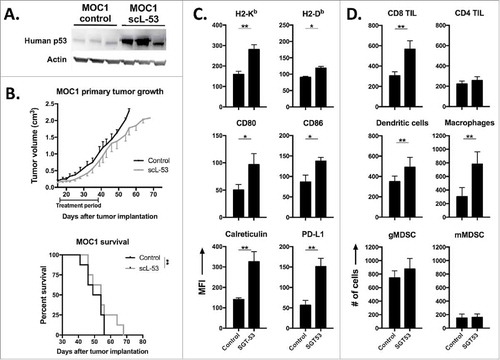
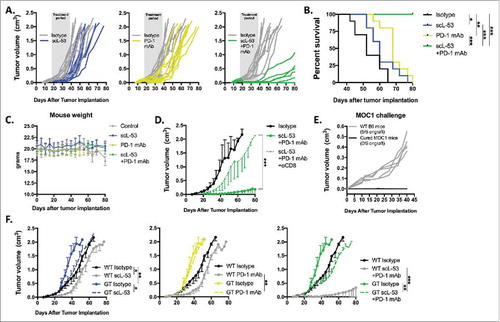
Figure 7. Combination scL-53 and PD-1 mAb induces CD8 and host STING-dependent rejection of a subset of established MOC1 tumors. Individual growth curves (A) and survival (B) following treatment of established MOC1 tumors (n = 9–10 mice/condition) with scL-53 (30 μg/injection, twice weekly x 3 weeks) alone or in combination with PD-1 mAb (200 μg twice weekly 3 weeks). C, treated MOC1 tumor-bearing mouse weight was plotted over time. D, treatment with combination scL-53 plus PD-1 mAb as in A was repeated with or without CD8+ cell depletion (clone YTS 169.4, n = 5 mice/condition)). E, naïve WT B6 mice or WT B6 mice that rejected established MOC1 tumors after combination scL-53 and PD-1 mAb treatment were challenged with subcutaneous injection of 3 × 10⁶ MOC1 cells and followed for tumor engraftment. F, MOC1 tumors were established in STING-deficient mice (GT; Tmem173gt, n = 5 mice/condition) and scL-53 treatment was repeated with or without PD-1 mAb as in A. Summary growth curves were analyzed via ANOVA of tumor volume at day 40 after tumor engraftment. For all in vivo experiments, shown are representative results from one of two independent experiments. Control mice for these experiments received TVI of PBS and IP injection of 200 μg of rat IgG2 Ab twice weekly. *, p < 0.05; **, p < 0.01; ***, P,0.001.