Figures & data
Figure 1. Regulatory T cells accumulate in ovarian cancer ascites. Frequencies of regulatory T cells were analysed by flow cytometry of peripheral blood mononuclear cells (PBMC) and ascites from patients with ovarian cancer (OC) compared to PBMC from healthy donors (HD). Tregs were gated as CD25hi CD127low/neg cells out of total live CD3+ CD4+ T cells. A) Representative dot plots of CD25hi CD127low/neg gating from HD PBMC, OC PBMC and OC Ascites respectively. B) Representative histograms of FoxP3 and CCR4 MFI of Tregs from OC ascites show a higher expression of FoxP3 and CCR4 compared to Tregs from HD PBMC and OC PBMC. C) Percentages of FoxP3+ Tregs and D) percentage of CCR4+ FoxP3+ Tregs in HD, OC PBMC and OC ascites. HD PBMC n = 13, OC PBMC n = 14, OC Ascites n = 13, Unpaired t-test, error bars designate mean with SEM, #P < 0.05, ##P < 0.01, ### P < 0.001.
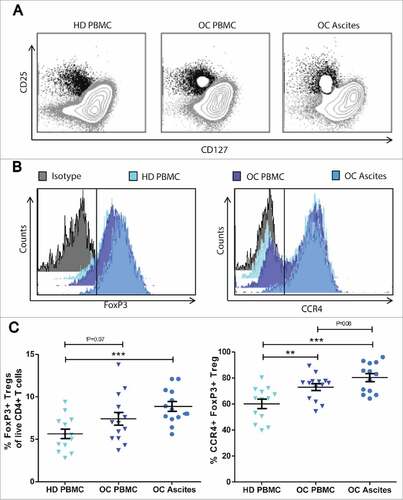
Figure 2. Chemokines and chemokine receptors in ovarian cancer. (A) 10-plex Luminex analyses of chemokine concentration (pg/ml) in cell free ascites (n = 13). 3 samples (one from CXCL8, and 2 from CXCL10) were excluded in the graph as they were out of range ( > 5000 pg/ml). (B) Expression of corresponding chemokine receptors on CD4+ and CD8+ T cells from ascites (blue bars, n = 13) and PBMC (gray bars, n = 14) of patients with serous adenocarcinoma of the ovaries. Unpaired t-test, error bars designate mean with SEM, #P < 0.05, ##P < 0.01, ### P < 0.001.
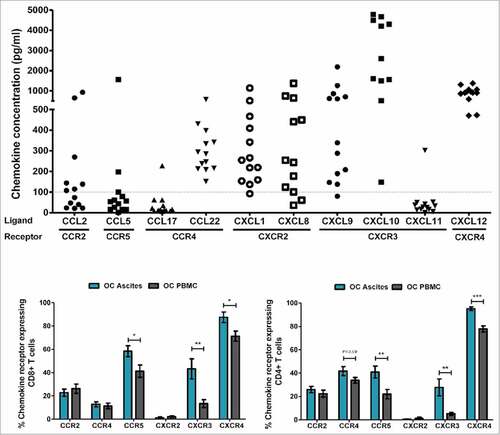
Figure 3. Maturation profile of peripheral blood T cells and TALs from ovarian cancer patients. The maturation profile of peripheral blood T cells, ex vivo TALs, young TALs and transduced REP TALs was assessed by the distribution of naïve, Tcm, Tem and Temra cells gated out of the live CD3+ T cell population. (A) Representative dot plots of gating strategy: CD45RA expression gated on the CD3+ T cells, and further subgated by CD62L and CD57 expression. (B-E) Frequencies of Tnaïve, Temra, Tem and Tcm, respectively, in OC PBMC (n = 12), ex vivo ascites (n = 12), young TAL cultures (n = 10) and REP TAL cultures (n = 8, 4 MOCK and 4 CXCR2 transduced). (F) Pie charts of maturation profile (mean) of Tnaïve, Temra, Tem and Tcm represented in B-E in addition to CD57+ Tem and “other”, as shown in gating strategy (A). Error bars designate standard deviation (SD), #P < 0.05, ##P < 0.01 and ###P < 0.001.
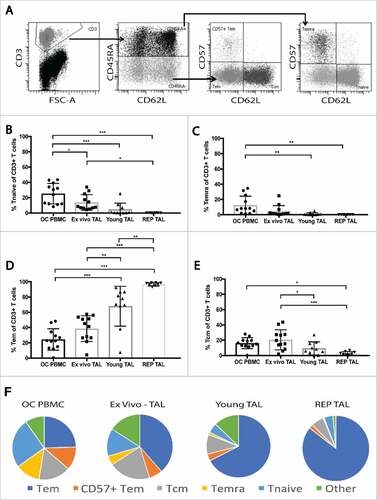
Figure 4. Cytokine profile of stimulated peripheral blood T cells and TALs from ovarian cancer patients. Cytokine production profile of peripheral blood T cells and TALs from patients with OC after 5h stimulation with leukocyte activation cocktail. A) Representative dot plots of IFNγ and TNFα expression gated on live CD3+ T cells. (B-E) shows the respective distribution of IFNγ single positive (SP), IFNγ TNFα double positive (DP), TNFα SP and IFNγ TNFα double negative (DN or “other”) CD3+ T cells, while (F) pie charts summarize the cytokine production profile (mean) of the data represented in (B-E). OC PBMC (n = 12), ex vivo ascites (n = 12), young TAL cultures (n = 10) and REP TAL cultures (n = 8, 4 MOCK and 4 CXCR2 transduced). Error bars designate standard deviation (SD), #P <0.05, ##P <0.01 and ###P <0.001.
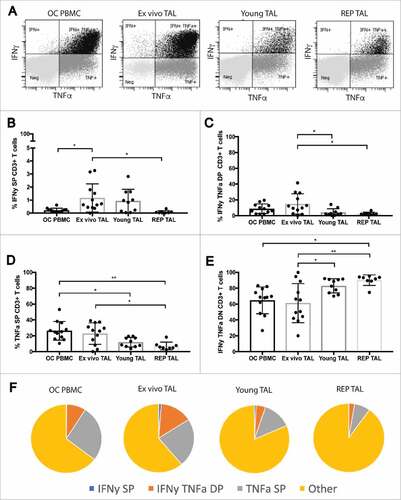
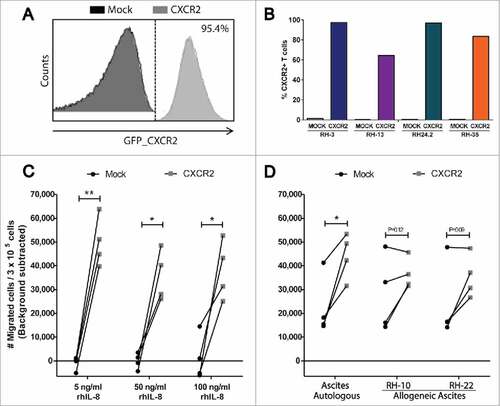
Figure 5. In vitro migration of CXCR2 transduced TALs. (A) Representative histogram of GFP_CXCR2 expression on CXCR2 transduced TALs, and (B) purity of sorted and expanded TAL cultures; one Mock- and CXCR2 transduced culture from each of 4 patients with OC (Blue: RH3, Purple: RH13, Green: RH24.2 and Orange: RH35). (C) Transwell migration of Mock- and CXCR2 transduced TALs towards increasing concentrations of rhIL-8 (5 ng/ml, 50 ng/ml, and 100 ng/ml), or D) autologous (RH-3, RH13, RH24.2 and RH35, respectively) or allogeneic ascites from two allo-OC patients (RH-10 and RH-22). Migration is represented as number of migrated cells / 3 × 10⁵ cells (background migration subtracted)/minute. Gray squares = CXCR2 transduced TALs, Black circles = Mock transduced TALs, Paired t-test, #P < 0.05, ##P < 0.01.