
Figures & data
Figure 1. SALL4 expression in human healthy adult tissues and gastro-intestinal tumor cell lines. (A) The absence of SALL4 gene expression in human healthy adult tissues was determined using GTEx resource database. (B) SALL4 protein expression by western blotting in PBMC and HeLa cell line (control), in colorectal tumor cell lines (HT29, Colo 205 and Colo320), in gastric tumor cell line (MKN45) and in pancreatic tumor cell lines (BXPC3, Bespac7, C7, 5 and 12).
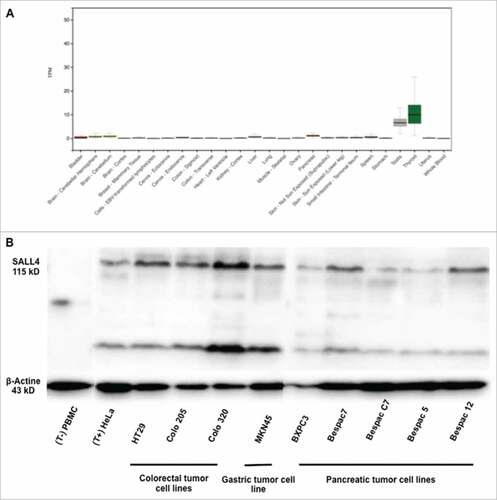
Table 1. Characteristics of HLA-A/B SALL4-specific-restricted peptides predicted by immune informatics database. SALL4 amino acid sequences were submitted to two prediction algorithms (NetMHCpan3 and SYPEITHI) and peptides binding prediction to HLA-A/B were classified as strong (+++), moderate (++), weak (+) or null (−).
Table 2. Characteristics of HLA-DR SALL4-specific-restricted peptides predicted by immune informatics database. SALL4 amino acid sequences were submitted to two prediction algorithms (NetMHCII2.2 and SYPEITHI) and peptides binding prediction to HLA-DR were classified as strong (+++), moderate (++), weak (+) or null (−).
Figure 2. Immune responses induced by SALL4 derived peptide's pools in T lymphocytes from healthy donors. PBMC were cultured during 28 days with the 5 pools of SALL4 derived peptides (15 µg/mL). T cell reactivity against peptide's pools was detected by IFN-γ ELISPOT assay as described in materials and methods. (A) Frequency of responding healthy donors (8/14) according to SALL4 derived peptide's pool. (B) Number and detailed of each recognized pools within the 14 healthy donors. Magnitude of T cell responses against SALL4 derived peptides for (C) pool 1 (p < 0.001), pool 2 (p < 0.001), (D) pool 3 (p < 0.05) and pool 5 (not significant). The CEF viral peptide pool was a positive control in ELISPOT IFN-γ assay.
Figure 3. Magnitude and frequency of positive responses induced by SALL4 derived peptide's pools in healthy donors and cancer patients. PBMC were cultured during 8 days with either the five pools of SALL4 derived peptides (15 µg/mL) (healthy donors) or pool 1 and 2 (cancer patients). T cell reactivity against the 5 pool of peptides was detected by IFN-γ ELISPOT assay as described in materials and methods. Results represented specific and positive IFN-γ spots after subtraction of background. Responses were positive when IFN-γ spots were more than 10 and more than 2-fold the background. Magnitude and frequency of spontaneous T cell responses against SALL4 derived peptides in (A) healthy donors (n = 14, controls) and (B) cancer patients (n = 28 GI cancer, n = 26 CML and n = 13 germinal cancer). The CEF viral peptide pool was a positive control in ELISPOT IFN-γ assay. GI, Gastro Intestinal; CML, Chronic Myeloid Leukemia.
Table 3. Mean, median and frequencies of T-cells responses in healthy donors and cancer patients according to peptides pools.
Table 4. HLA-DR genotyping of several healthy donors and cancer patients.
Figure 4. Frequency of responding healthy donors and GI cancer patients against SALL4 derived peptides and magnitude of responses induced by these peptides. PBMC were cultured during 8 days with distinct SALL4 derived peptides (5 µg/mL). T cell reactivity against SALL4 derived peptides pools was detected by IFN-γ ELISPOT assay as described in materials and methods. The results represented specific IFN-γ spots after subtraction of background. Responses were positive when IFN-γ spots were more than 10 and more than 2-fold the background. Each result presented in the dot plot related to the ELISPOT assays are the mean of duplicates. (A) Frequency of positive responses against R18 A, T15 V and K20P peptides among healthy donors (n = 7, controls) and GI cancer patients (n = 6) who had at least one positive response. (B) Corresponding magnitude of spontaneous T cell responses against R18 A, T15 V and K20P peptides. (C) Frequency of positive responses against A18 K, S25 L and P25 N peptides among healthy donors (n = 10, controls) and GI cancer patients (n = 5) who had at least one positive response. (D) Corresponding magnitude of spontaneous T cell responses against A18 K, S25 L and P25 N peptides. GI, Gastro Intestinal.
Figure 5. Functional and phenotypic characteristics of A18 K specific HD5.1 clone. PBMC from a healthy donor in whom a positive response to pool 2 was previously observed were cultured with distinct peptides from pool 2 during 8 days (5 µg/mL). Using the single cell level dilution method, one CD4 T cell clone specific for A18 K peptide, HD5.1, was isolated. (A) HLA-II restriction of HD5.1 T cell clone was assessed by performing an IFN-γ intracellular staining in presence of anti-HLA-DP/DQ/DR antibodies. Percentage of IFN-γ producing T-cell clones (left panel) and mean frequencies of IFN-γ secretion (right panel) was shown. (B) Assessment of HD5.1 clone activation using cells lines harboring similar HLA-DR restriction, Colo205 (stimulated 48 hours using IFN-γ, 1000 UI/mL) and B-EBV HD5, previously loaded with A18 K peptide, by performing an IFN-γ intracellular staining. HD5.1 T cell clone secreted INF-γ in presence of B-EBV HD5 (84.33 +/− 6.70%) and Colo 205 (47.75 +/− 13.45%) loaded with A18 K peptide, whereas not without the peptide loaded on the two cell lines (p < 0.001). (C) Functional avidity of HD5.1 T cell clone was evaluated after stimulation with a range of the indicated increasing A18 K peptide concentrations (XX as irrelevant peptide). (D) HD5.1 T cell clone chemokine receptor pattern was determined by flow cytometry using CXCR3, CCR4, CCR6, CRTh2 and CXCR5 antibodies. (E) Polarization of HD5.1 T-cell clone responses. Detection of cytokine production by DIAplex assay in supernatant after 15 h of culture in presence of A18 K peptide. All data are representative of at least 3 independent experiments.
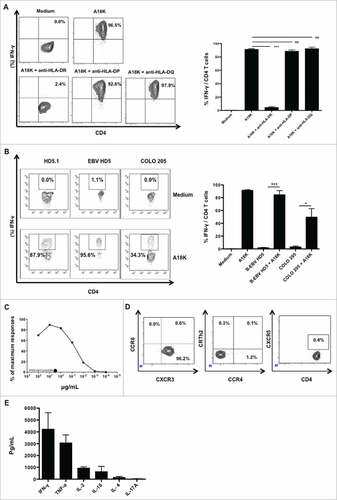
Figure 6. A18 K peptide was naturally processed and presented by moDC. moDC were generated from Ficoll-isolated PBMCs from healthy donors selected according to their HLA-DR typing (similar to the clone), as described in material and methods. At day 5, immature moDC were incubated with SALL4 lysate for 8 hours. Mature moDC were generated using LPS. Pulsed cells were washed twice and added at HD5.1 T cell clone overnight. HD5.1 clone's activation was assessed by performing an IFN-γ intracellular staining. (A) SALL4 expression by qRT-PCR in PBMC (control) and HeLa cell line. (B) SALL4 protein expression by western blotting in PBMC (control) and HeLa cell line. (C) HD5.1 T cell clone secreted INF-γ in presence of moDC alone (18.03 +/− 3.07%), moDC loaded with PBMC lysate protein (24.73 +/− 3.42%) and moDC loaded with HeLa lysate protein (49.23 +/− 14.02%) (p < 0.05). Percentage of IFN-γ producing T-cell clones (left panel) and mean frequencies of IFN-γ secretion (right panel) was shown. All data are representative of at least 3 independent experiments.
Table 5. Baseline clinical characteristics of patients.