
Figures & data
Table 1. Patient characteristics and tumor pathology by TIL PD-1 positivity (N = 82).
Figure 1. Photomicrograph (20x magnified) of lymphocytes infiltrating clear cell RCC tumor, stained for PD-1. 1 A (left): H&E stained primary clear cell renal cell carcinoma. 1B (right): PD-1 stained primary clear cell renal cell carcinoma. TILs expressing PD-1 are stained brown on cell membrane. The estimated value of PD-1 positivity of this slide is 40%. Black arrow: PD-1 positive lymphocyte; Red arrow: PD-1 negative RCC tumor cell.
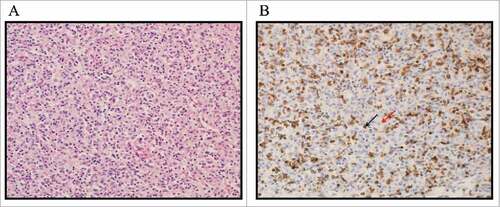
Table 2. Distribution of TIL PD-1 expression and its impact on risk of death.
Table 3. Distribution of TIL PD-1 expression and its impact on risk of recurrence.
Figure 2. Kaplan-Meier curves on overall survival by TIL PD-1 expression. 2 A (left): TIL PD-1 expression stratified negative (<1% stained, blue) / positive (≥ 1% stained, red). 2B (right): TIL PD-1 expression stratified negative (<1% stained, green) / low (<10 and 10%, red) / high (20–50%, blue). Vertical tick marks represent censored subjects.
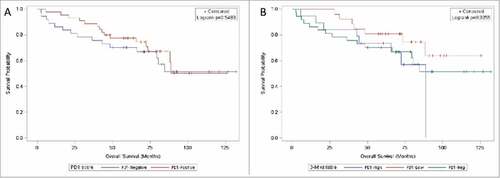
Figure 3. Kaplan-Meier curves on recurrence-free survival by TIL PD-1 expression. 3 A (left): TIL PD-1 expression stratified negative (<1% stained, blue) / positive (≥ 1% stained, red). 3B (right): TIL PD-1 expression stratified negative (<1% stained, green) / low (<10 and 10%, red) / high (20–50%, blue). Vertical tick marks represent censored subjects.
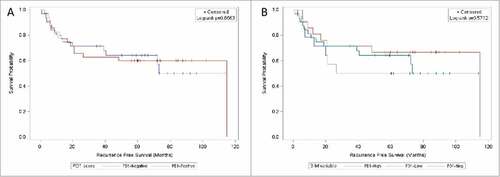
Table 4. Distribution of pT stage and FNG and their impact on risk of death and risk of recurrence.
Table 5. Studies that correlated PD-1 or PD-L1 expression in tumor cells or in immune cells with clinical outcome in the descending order of publication.