Figures & data
Figure 1. Characterizing Il7-expressing fibroblasts in syngeneic orthotopic breast tumors. (A) 5 × 10⁵ E0771 cells were grafted in the MFP of Il7-EYFP mice, and tumors and tdLNs were harvested at day 14. Tissue sections were stained with the indicated antibodies and analyzed by confocal microscopy. (B) Boxed area close-up of (A). (C) Confocal microscopic analysis of PDPN-expressing EYFP+ CAFs for Ki-67 expression. Data are representative examples of at least three independently performed experiments (n > 3).
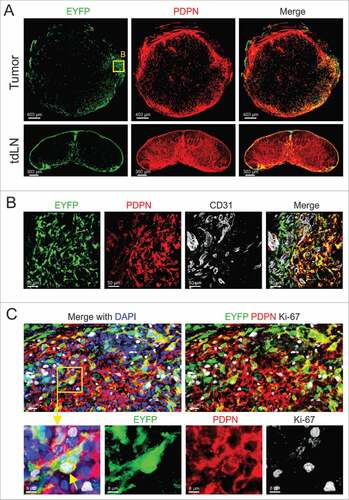
Figure 2. Cellular composition of mammary carcinomas in Il7-EYFP mice. (A) Flow cytometry-based enumeration of the indicated cell populations at day 14 post inoculation of 5 × 10⁵ E0771-tdT cells (n = 6–10). Note that EYFP+ cells are PDPN+. (B) Flow cytometric characterization of EYFP+ cells from tumors and tdLNs (n = 4–6). (C) Comparative flow cytometric profiling of EYFP+ and EYFP−PDPN+ breast CAFs (n = 6–8). (D+E) Confocal microscopic analysis of EYFP+ and EYFP−PDPN+ breast CAFs and tdT-labeled tumor cells (representative images from four independently performed experiments).
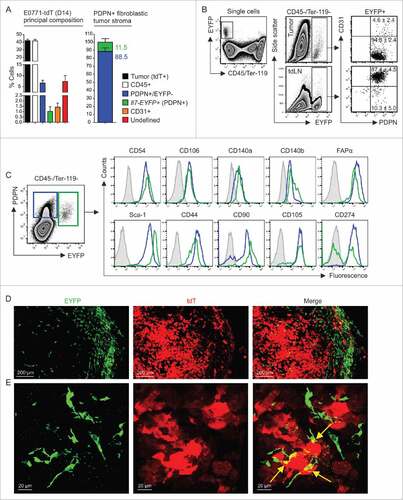
Figure 3. Impact of toxin-mediated ablation of Il7-expressing fibroblasts on breast tumor growth. E0771 cells were orthotopically grafted in Il7-iDTR/EYFP mice and transgene-expressing CAFs were ablated by intratumoral administration of DT (1 ng on days 6, 8 and 10). (A) Flow cytometric assessment of cell ablation in day 14 tumors (n = 4–10). (B) Assessment of the integrity of the fibroblastic reticular cell network in tdLNs using confocal microscopy. (C) Flow cytometric analysis of T cell activation in the tdLN (n = 5). (D-F) Unilateral tumors were induced in Il7-iDTR or Cre-negative control mice (iDTR-positive genetic background), and susceptible CAFs were ablated using treatment with DT, as indicated. Tumor growth was monitored on a daily basis and tumor weight was recorded on day 14 (n = 8–9). (G-I) Bilateral tumors were induced in Il7-iDTR mice and only the ipsilateral side was treated with DT, while the contralateral side was treated with vehicle (PBS) (n = 8). Microscopy data are representative examples of two independently performed experiments. Statistical testing used: Student's t-test for panels A, C, F and I, and repeated measures ANOVA for panels E and H (#p < 0.05, ###p < 0.001).
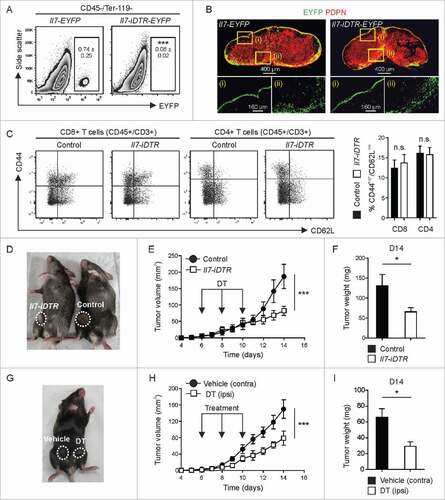
Figure 4. Impact of ablation of Il7-expressing fibroblasts on CSC properties. E0771-tdT cells were orthotopically grafted in Il7-iDTR or Cre-negative control mice, and ablated and non-ablated tumors were analyzed for phenotypic and functional CSC markers at day 14. (A) E0771-tdT cells were sorted and the clonogenic potential of the recovered cells was investigated under ultra-low attachment conditions (left panel) (n = 9–10). Post sort purity of the input cells routinely exceeded 98% (right panel). (B+C) Flow cytometric assessment of breast CSC marker expression by E0771-tdT cells recovered from ablated and non-ablated tumors, expressed as background-subtracted MFI (n = 9–10). Statistical testing used: Student's t-test for panels A-C (#p < 0.05, ###p<0.001).
Figure 5. Oncogenic signature and stem cell factor expression by Il7-producing fibroblasts. Unilateral E0771 tumors were induced in Il7-EYFP mice and EYFP+PDPN+ (‘EYFP’) and EYFP−PDPN+ (‘PDPN’) CAFs were sorted from day 14–16 tumors. Samples were processed and microarray analysis was conducted. (A) 3D PCA of EYFP+ (n = 7) and PDPN+ (n = 6) breast CAFs. (B) Volcano plot analysis indicating differential expression of 1731 genes. (C) Functional pathway analysis by GSEA. (D-F) Heatmap analysis indicating upregulation of various growth- and stem cell factors as well as cytokines and chemokines by EYFP+ CAFs. (G) RT-PCR-based validation of microarray data for the indicated genes (n = 7–8). Statistical testing used: Mann-Whitney U test for panel G (for statistical details on panels A-F see Microarray analysis) (#p < 0.05, ##p < 0.01, ###p < 0.001).
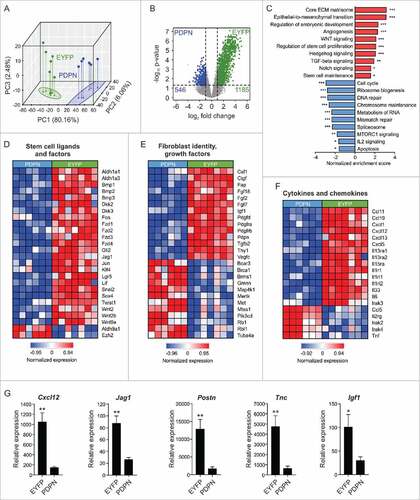
Figure 6. Pharmacological targeting of CXCR4 or conditional ablation of Cxcl12 depletes breast tumor-initiating potential. (A) 104 E0771 or (B) 103 4T1 cells were orthotopically grafted in syngeneic wild-type hosts (i.e., C57BL/6 or BALB/c) and animals were treated systemically (i.p.) with 5 mg/kg AMD3100 or vehicle (PBS) on days 0 and 3 post tumor challenge, respectively (n = 15–16). Tumor outgrowth and time to engraftment were monitored. (C) 104 E0771 cells were orthotopically grafted in Il7-Cre Cxcl12fl/fl hosts and Cre-negative controls (carrying homozygous Cxcl12fl/fl alleles), and tumor outgrowth and time to engraftment were monitored (n = 5–8). Statistical testing used: Log-rank test for Kaplan-Meier curves, and Mann-Whitney U test for the remaining panels.
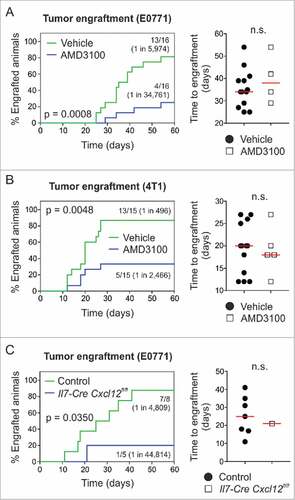
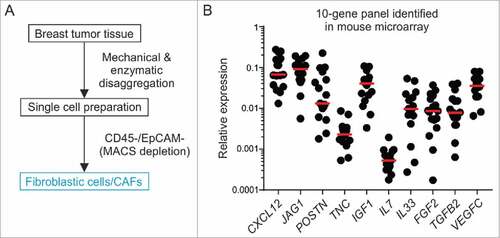
Figure 7. Primary human breast CAFs express stemness-related genes including CXCL12. (A) Schematic illustrating the workflow and strategy for isolating CAFs from fresh surgical BC specimens. (B) RT-PCR analysis of enriched breast CAFs for a 10-gene panel identified in the mouse microarray (n = 17).