Figures & data
Table 1. Patient characteristicsFootnote#.
Figure 1. Global CLL and non-malignant B cell count in the peripheral blood. Changes in cell count were determined by flow cytometry and IGH next-generation sequencing prior, 24 months and 42 months after chemoimmuntherapy (FCR) or prior, 12 months, 24 months and 42 months after initiation of ibrutinib and from age-matched healthy donors (HD) A: Change in CLL cell count. B: Change in non-malignant B cell count. Horizontal lines show mean values and error bars show the SEM, n = 2-10 for each group. Statistical significance testing was performed using student's t-test.
Figure 2. Distribution of experienced and naïve non-malignant B cells. Hypermutated antigen-experienced non-malignant B cells determined through NGS. Samples were analyzed prior, 24 months and 42 months after FCR or prior, 12 months, 24 months and 42 months after initiation of ibrutinib treatment and from age-matched healthy donors (HD). Horizontal lines show mean values and error bars show the SEM, n = 2-10 for each group. Statistical significance testing was performed using student's t-test.
Figure 3. Exemplary IGH clonotype distribution of non-malignant B cell repertoires in the peripheral blood. A: Exemplary FCR treated patient. B: Exemplary ibrutinib treated patient. Coordinates of each dot are defined by the unique VH, DH and JH gene rearrangement. VH gene subgroups (V1-2 – V7-81) are shown from left to right, DH gene subgroups (D1-1 – D7-27) are shown from bottom to top. Dot size corresponds to the frequency. Blue color: unmutated VH gene sequence, red: hypermutated VH gene sequence.
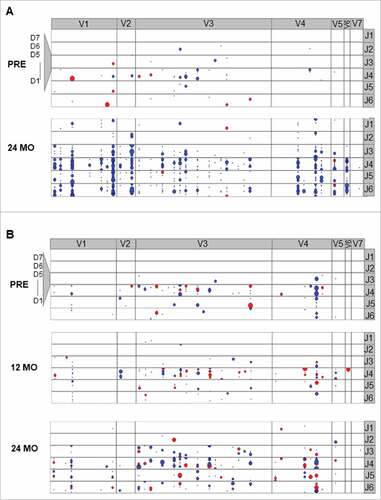
Figure 4. Diversity of the non-malignant B cell repertoire. A and B: Diversity of the non-malignant IGH repertoire based on genomic DNA with Shannon-Wiener and inverse Simpson diversity index. C and D: Isotype specific IGH repertoire diversity based on RNA sequencing with Shannon-Wiener and inverse Simpson diversity index. Horizontal lines show mean values and error bars show the SEM, n = 5-10 for each group. Statistical significance testing was performed using student's t-test.