2,214
Views
14
CrossRef citations to date
0
Altmetric
Original Research

Tumor-derived thymic stromal lymphopoietin enhances lung metastasis through an alveolar macrophage-dependent mechanism

, , , &
Article: e1419115 | Received 10 Nov 2017, Accepted 12 Dec 2017, Published online: 16 Jan 2018

Figures & data

Figure 1. Knockdown of TSLP reduces primary tumor growth and spontaneous metastasis. (A) Serum TSLP concentration as measured by ELISA in 4T1 tumor-bearing BALB/c mice (n = 11) reflecting varying tumor volumes. Data analyzed by Spearman correlation. (B) TSLP expression as measured by qRT-PCR analysis. Data normalized to the housekeeping gene GAPDH and 4T1-VC group set to 1.0 to determine relative expression of the 4T1-KD group (silenced with construct ID v2MM_53644; clone 1). (C) TSLP concentration in cell-free supernatants of the indicated cell lines (1 × 10⁶ cells/ml after 24 hours), as measured by ELISA. Results in B & C represent the mean ± SEM of 3 or 4 separate experiments, respectively. (D) Tumor growth of the indicated cell population in wild-type (WT) female BALB/c mice. Growth differences are significant at all time points measured (each line represents a single mouse (n = 16 4T1-KD, n = 17 4T1-VC; compilation of 3 independent experiments). (E) Spontaneous metastasis of the indicated cell populations at endpoint when primary tumor volumes between groups were comparable. Lung metastatic foci quantified using H&E-stained slides (each point represents an individual mouse; compilation of 3 independent experiments; n = 10 4T1-KD, n = 13 4T1-VC). (F) Survival post-surgical resection of the primary tumor in WT female BALB/c mice (n = 17 4T1-KD, n = 14 4T1-VC; compilation of 2 independent experiments). *P < 0.05, **P < 0.01.
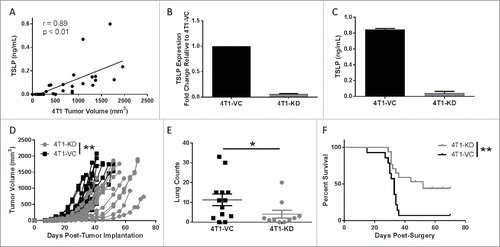
Figure 1. Knockdown of TSLP reduces primary tumor growth and spontaneous metastasis. (A) Serum TSLP concentration as measured by ELISA in 4T1 tumor-bearing BALB/c mice (n = 11) reflecting varying tumor volumes. Data analyzed by Spearman correlation. (B) TSLP expression as measured by qRT-PCR analysis. Data normalized to the housekeeping gene GAPDH and 4T1-VC group set to 1.0 to determine relative expression of the 4T1-KD group (silenced with construct ID v2MM_53644; clone 1). (C) TSLP concentration in cell-free supernatants of the indicated cell lines (1 × 10⁶ cells/ml after 24 hours), as measured by ELISA. Results in B & C represent the mean ± SEM of 3 or 4 separate experiments, respectively. (D) Tumor growth of the indicated cell population in wild-type (WT) female BALB/c mice. Growth differences are significant at all time points measured (each line represents a single mouse (n = 16 4T1-KD, n = 17 4T1-VC; compilation of 3 independent experiments). (E) Spontaneous metastasis of the indicated cell populations at endpoint when primary tumor volumes between groups were comparable. Lung metastatic foci quantified using H&E-stained slides (each point represents an individual mouse; compilation of 3 independent experiments; n = 10 4T1-KD, n = 13 4T1-VC). (F) Survival post-surgical resection of the primary tumor in WT female BALB/c mice (n = 17 4T1-KD, n = 14 4T1-VC; compilation of 2 independent experiments). *P < 0.05, **P < 0.01.

Figure 2. The pro-metastatic effects of TSLP are not due solely to differences in extravasation. In all panels, WT female BALB/c mice were injected intravenously with the indicated cell population (5 × 10⁴cells/mouse). Mice were euthanized when the 4T1-VC group showed signs of morbidity, typically 26–30 days post-injection. (A) Images post-India ink staining of tumor-bearing lungs, with data quantified in (B) (each point represents an individual mouse; compilation of 3 independent experiments; n = 12 4T1-KD, n = 11 4T1-VC). (C) RT-PCR analysis (top) and quantification (bottom) of AH1 expression in the lungs of non-tumor-bearing (NTB; n = 2) or the indicated tumor-bearing mice 2–3 days post-tumor injection. (D) RT-PCR (top) and quantification (bottom) of TSLP expression of tumor cells propagated ex vivo from the lungs of the indicated tumor-bearing mice. In C and D, each lane represents an individual mouse (n = 4–5 mice per group). *P < 0.05; **P < 0.01; ns, P = 0.68.
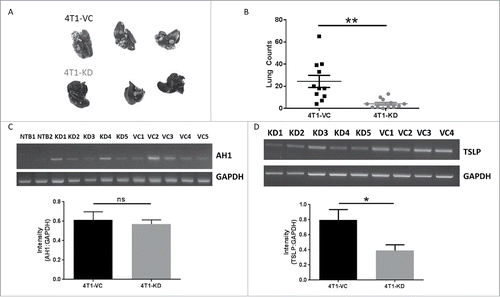
Figure 2. The pro-metastatic effects of TSLP are not due solely to differences in extravasation. In all panels, WT female BALB/c mice were injected intravenously with the indicated cell population (5 × 10⁴cells/mouse). Mice were euthanized when the 4T1-VC group showed signs of morbidity, typically 26–30 days post-injection. (A) Images post-India ink staining of tumor-bearing lungs, with data quantified in (B) (each point represents an individual mouse; compilation of 3 independent experiments; n = 12 4T1-KD, n = 11 4T1-VC). (C) RT-PCR analysis (top) and quantification (bottom) of AH1 expression in the lungs of non-tumor-bearing (NTB; n = 2) or the indicated tumor-bearing mice 2–3 days post-tumor injection. (D) RT-PCR (top) and quantification (bottom) of TSLP expression of tumor cells propagated ex vivo from the lungs of the indicated tumor-bearing mice. In C and D, each lane represents an individual mouse (n = 4–5 mice per group). *P < 0.05; **P < 0.01; ns, P = 0.68.

Figure 3. TSLP-mediated effects on metastasis are independent of the adaptive immune system. (A) Primary tumor growth of the indicated cell population in SCID mice, as in (n = 15 per group). (B) Quantification of spontaneous lung metastasis of the indicated cell population at endpoint tumor volumes in A (n = 15 per group). (C) Experimental lung metastasis in SCID mice, as in (n = 9-10 per group). (D and E) Similar to A and B, except that tumor growth studies were performed in athymic mice (n = 9-10 per group). Each line or data point represents results from an individual mouse; compilation of 2 independent experiments in all panels. **P < 0.01; ***P < 0.001; ns, P > 0.1.
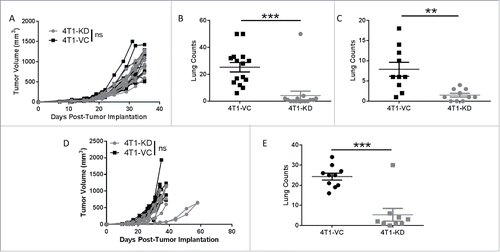
Figure 3. TSLP-mediated effects on metastasis are independent of the adaptive immune system. (A) Primary tumor growth of the indicated cell population in SCID mice, as in Fig. 1 (n = 15 per group). (B) Quantification of spontaneous lung metastasis of the indicated cell population at endpoint tumor volumes in A (n = 15 per group). (C) Experimental lung metastasis in SCID mice, as in Fig. 2 (n = 9-10 per group). (D and E) Similar to A and B, except that tumor growth studies were performed in athymic mice (n = 9-10 per group). Each line or data point represents results from an individual mouse; compilation of 2 independent experiments in all panels. **P < 0.01; ***P < 0.001; ns, P > 0.1.

Figure 4. TSLP exerts its pro-metastatic effects via alveolar macrophages. (A) The indicated tumor cell population was injected intravenously into BALB/c mice (n = 14-15 per group; compilation of 3 independent experiments) as in , and then administered either clodronate (indicated by “+”) or control liposomes (indicated by “-”) via an intranasal route as described in the Materials and Methods. VC+ vs KD+, P = 0.06; KD+ vs. KD-, P = 0.08. (B) Quantification of AM or IMs (mean ± SEM of 3 separate mice per condition), based on the flow gating strategy (C) at endpoint. AMs were first gated on CD45+ cells, followed by gating on CD11blo/− cells and then CD11c+F4/80+ cells. IMs were first gated on CD45+ cells, followed by gating on CD11b+F4/80+ cells. ns, P > 0.07 for all comparisons. (D) Similar to A, except that clodronate or control liposomes were delivered intraperitoneally into mice (n = 9-10 mice per group; compilation of 2 independent experiments). VC+ vs. VC-, P = 0.08. (E) Quantification of macrophages in the spleen (ns, P = 0.51) or peripheral blood (mean ± SEM of 4–5 mice per condition; ns, P = 0.11) based on the flow gating strategy in Supplemental Figure 5. *P < 0.05; **P < 0.01; ns, not significant.
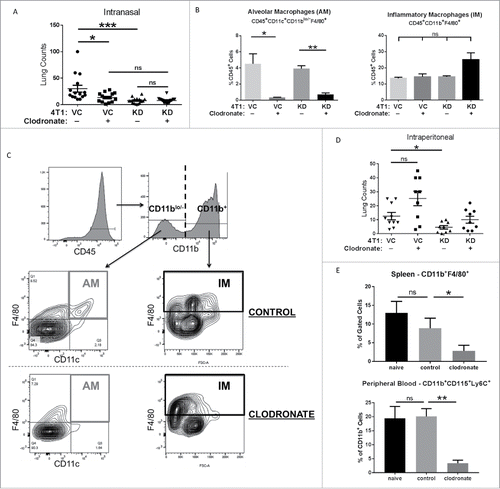
Figure 4. TSLP exerts its pro-metastatic effects via alveolar macrophages. (A) The indicated tumor cell population was injected intravenously into BALB/c mice (n = 14-15 per group; compilation of 3 independent experiments) as in Fig. 2, and then administered either clodronate (indicated by “+”) or control liposomes (indicated by “-”) via an intranasal route as described in the Materials and Methods. VC+ vs KD+, P = 0.06; KD+ vs. KD-, P = 0.08. (B) Quantification of AM or IMs (mean ± SEM of 3 separate mice per condition), based on the flow gating strategy (C) at endpoint. AMs were first gated on CD45+ cells, followed by gating on CD11blo/− cells and then CD11c+F4/80+ cells. IMs were first gated on CD45+ cells, followed by gating on CD11b+F4/80+ cells. ns, P > 0.07 for all comparisons. (D) Similar to A, except that clodronate or control liposomes were delivered intraperitoneally into mice (n = 9-10 mice per group; compilation of 2 independent experiments). VC+ vs. VC-, P = 0.08. (E) Quantification of macrophages in the spleen (ns, P = 0.51) or peripheral blood (mean ± SEM of 4–5 mice per condition; ns, P = 0.11) based on the flow gating strategy in Supplemental Figure 5. *P < 0.05; **P < 0.01; ns, not significant.

Figure 5. VEGF-A is differentially expressed in AMs in vivo in response to TSLPhi vs. TSLPlo tumor settings. (A) Strategy shown for the experimental design and RNA sample selection for panel B. (B) VEGF-A expression as measured by qRT-PCR analysis. 100 ng/mL recombinant TSLP was added to the AM/4T1-KD co-culture system and gene expression was quantified. (C) VEGF-A expression of AMs in vivo collected from the indicated tumor-bearing mice at 7 (left), 14 (middle) or 28 (right) days post-intravenous injection. For B and C, data were normalized to the housekeeping gene GAPDH. Then one 4T1-VC sample in panel B (n = 3 biologic replicates) or one 4T1-VC sample from each time point in panel C was set to 1.0 to determine the relative expression of the other samples. Panel C represents a total of 9 separate mice per tumor-bearing group, covering the 3 distinct time points shown. Therefore, at each time point, 3 separate mice from each cohort were analyzed, and for each mouse, 3–4 technical replicates were collected. Results represent the mean ± SEM of all replicates for each tumor-bearing group at each time point. *P < 0.05; **P < 0.01; ***P < 0.001; ns, P > 0.1.

Figure 5. VEGF-A is differentially expressed in AMs in vivo in response to TSLPhi vs. TSLPlo tumor settings. (A) Strategy shown for the experimental design and RNA sample selection for panel B. (B) VEGF-A expression as measured by qRT-PCR analysis. 100 ng/mL recombinant TSLP was added to the AM/4T1-KD co-culture system and gene expression was quantified. (C) VEGF-A expression of AMs in vivo collected from the indicated tumor-bearing mice at 7 (left), 14 (middle) or 28 (right) days post-intravenous injection. For B and C, data were normalized to the housekeeping gene GAPDH. Then one 4T1-VC sample in panel B (n = 3 biologic replicates) or one 4T1-VC sample from each time point in panel C was set to 1.0 to determine the relative expression of the other samples. Panel C represents a total of 9 separate mice per tumor-bearing group, covering the 3 distinct time points shown. Therefore, at each time point, 3 separate mice from each cohort were analyzed, and for each mouse, 3–4 technical replicates were collected. Results represent the mean ± SEM of all replicates for each tumor-bearing group at each time point. *P < 0.05; **P < 0.01; ***P < 0.001; ns, P > 0.1.

Figure 6. TSLP alters the tissue remodeling and angiogenesis pathways in AMs. AM/tumor co-cultures were utilized for all panels; strategy for the experimental design and RNA sample selection shown in . (A) Heat-map of differential gene expression between AMs co-cultured with either 4T1-VC or 4T1-KD cells in two independent biologic experiments. Data shown highlight the genes most highly upregulated (red) or downregulated (green) (by 4.66-fold) for the two biologic replicates. (B) Data summarizes the number of differentially regulated genes (>2-fold, up or down) in 4T1-VC vs. 4T1-KD cells among the 84 total genes analyzed in this format. (C, left; D) Selected genes in A were validated by qRT-PCR analysis using the same RNA employed for the expression array. Data were normalized to the housekeeping gene GAPDH, and the 4T1-VC group set to 1.0 to determine relative expression of the 4T1-KD group. (C, right) VEGF-A protein levels as measured by ELISA. For data in C and D, the results represent the mean ± SEM of all replicates (n = 4/experiment or 8 total for the ELISA; n = 3–4/experiment or 6–8 total for the qRT-PCR) covering the two independent biologic experiments performed at different times. (E) The indicated tumor cell population was implanted orthotopically into mice (n = 3–5 per group), and the lungs were collected at endpoint for analysis by immunohistochemistry for CD31 expression. Left, Representative photomicrographs of CD31-immunostained metastatic lesions of mice bearing the indicated tumor cell population (20X magnification; scale bar represents 100-μm). Right, Quantification of microvessel density, as described in the Methods section. *P < 0.05; **P < 0.01; ***P < 0.001.
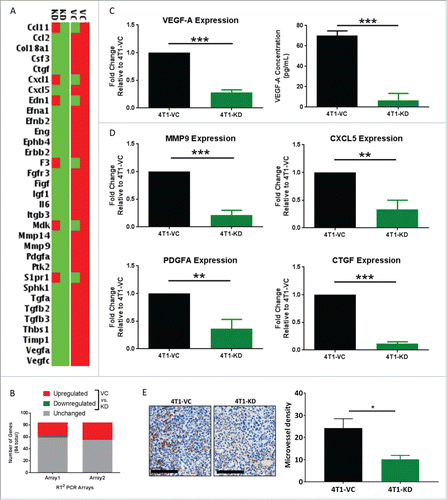
Figure 6. TSLP alters the tissue remodeling and angiogenesis pathways in AMs. AM/tumor co-cultures were utilized for all panels; strategy for the experimental design and RNA sample selection shown in Fig. 5A. (A) Heat-map of differential gene expression between AMs co-cultured with either 4T1-VC or 4T1-KD cells in two independent biologic experiments. Data shown highlight the genes most highly upregulated (red) or downregulated (green) (by 4.66-fold) for the two biologic replicates. (B) Data summarizes the number of differentially regulated genes (>2-fold, up or down) in 4T1-VC vs. 4T1-KD cells among the 84 total genes analyzed in this format. (C, left; D) Selected genes in A were validated by qRT-PCR analysis using the same RNA employed for the expression array. Data were normalized to the housekeeping gene GAPDH, and the 4T1-VC group set to 1.0 to determine relative expression of the 4T1-KD group. (C, right) VEGF-A protein levels as measured by ELISA. For data in C and D, the results represent the mean ± SEM of all replicates (n = 4/experiment or 8 total for the ELISA; n = 3–4/experiment or 6–8 total for the qRT-PCR) covering the two independent biologic experiments performed at different times. (E) The indicated tumor cell population was implanted orthotopically into mice (n = 3–5 per group), and the lungs were collected at endpoint for analysis by immunohistochemistry for CD31 expression. Left, Representative photomicrographs of CD31-immunostained metastatic lesions of mice bearing the indicated tumor cell population (20X magnification; scale bar represents 100-μm). Right, Quantification of microvessel density, as described in the Methods section. *P < 0.05; **P < 0.01; ***P < 0.001.
Supplemental material

Supplemental.Data_1419115.edited.docx

Download MS Word (1.6 MB)