2,641
Views
60
CrossRef citations to date
0
Altmetric
Brief Report

Prognosis of ovarian cancer is associated with effector memory CD8+ T cell accumulation in ascites, CXCL9 levels and activation-triggered signal transduction in T cells

, , , ORCID Icon, , , , , , & show all
Article: e1424672 | Received 22 Sep 2017, Accepted 03 Jan 2018, Published online: 15 Mar 2018

Figures & data

Figure 1. Abundance of subsets of CD8+ and CD4+ T cell subpopulations in human ovarian cancer ascites. (A) Flow cytometry analysis of CD8+ T cells from: blood of patients with benign disease (“normal blood”), blood of ovarian cancer patients (“patient blood”) and ascites of ovarian cancer patients (“ascites”). The gating for T cell subpopulations was performed based on the surface expression of CD45RA and CCR7 markers. Four T cell subpopulations were identified as follows: naïve (CD45RA+CCR7+), central memory (CD45RACCR7+), effector memory (CD45RACCR7), effector (CD45RA+CCR7). The gating strategy is shown in Figure S1, and pairwise correlations in Figure S2 (B) Analysis of CD4+ T cells subpopulations as in panel A. Statistical analysis was performed by unpaired t test (**: p < 0.01; ns: not significant). Samples sizes: normal blood, n = 10; patient blood, n = 41; ascites, n = 49). (C) Association of the different CD4 and CD8 T cell populations with ovarian cancer RFS (logrank test). Best fit p values are shown. Due to the relatively small sample size the significance threshold was set to 0.01 (dashed line; **: p < 0.01). Numbers at the top show the quantiles (0.33, 0.5, 0.66) yielding the most significant dichotomization of the samples (best fit). Dark blue: significant p value (< 0.01) and hazard ratio <1; light grey blue: p > 0.01. (D) Kaplan-Meier analysis of the association of abundance of CD8+ TEM (% CD45RACCR7) with ovarian cancer RFS. Samples were dichotomized at the upper tercile (q = 0.66). p: logrank p-value; HR: hazard ratio; rfs: RFS for high versus low levels; inf: infinite (> 56 months).
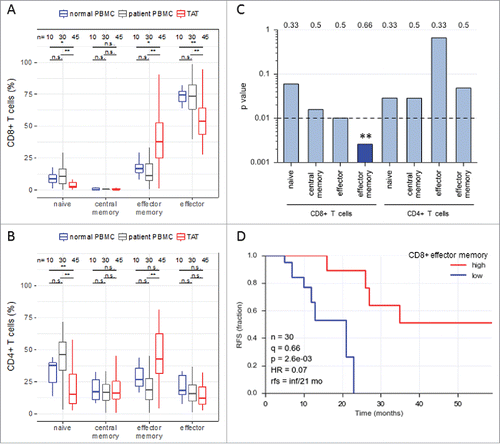
Figure 1. Abundance of subsets of CD8+ and CD4+ T cell subpopulations in human ovarian cancer ascites. (A) Flow cytometry analysis of CD8+ T cells from: blood of patients with benign disease (“normal blood”), blood of ovarian cancer patients (“patient blood”) and ascites of ovarian cancer patients (“ascites”). The gating for T cell subpopulations was performed based on the surface expression of CD45RA and CCR7 markers. Four T cell subpopulations were identified as follows: naïve (CD45RA+CCR7+), central memory (CD45RA−CCR7+), effector memory (CD45RA−CCR7−), effector (CD45RA+CCR7−). The gating strategy is shown in Figure S1, and pairwise correlations in Figure S2 (B) Analysis of CD4+ T cells subpopulations as in panel A. Statistical analysis was performed by unpaired t test (**: p < 0.01; ns: not significant). Samples sizes: normal blood, n = 10; patient blood, n = 41; ascites, n = 49). (C) Association of the different CD4 and CD8 T cell populations with ovarian cancer RFS (logrank test). Best fit p values are shown. Due to the relatively small sample size the significance threshold was set to 0.01 (dashed line; **: p < 0.01). Numbers at the top show the quantiles (0.33, 0.5, 0.66) yielding the most significant dichotomization of the samples (best fit). Dark blue: significant p value (< 0.01) and hazard ratio <1; light grey blue: p > 0.01. (D) Kaplan-Meier analysis of the association of abundance of CD8+ TEM (% CD45RA−CCR7−) with ovarian cancer RFS. Samples were dichotomized at the upper tercile (q = 0.66). p: logrank p-value; HR: hazard ratio; rfs: RFS for high versus low levels; inf: infinite (> 56 months).

Figure 2. Association of CXCL9 levels in ovarian cancer ascites with relapse-free survival (RFS). (A) Expression of the genes encoding CXCR3 and its ligands CXCL9, CXCL10 and CXCL11 in tumor cells (TU) depicted in red, tumor-associated macrophages (TAM) depicted in blue and tumor-associated T cells (TAT) depicted in green from ovarian cancer ascites (TPM values determined by RNA-Seq). (TU, n = 23; TAM, n = 28; TAT, n = 6). MSLN, CD163 and LCK served as cell-type-specific markers for TU, TAM and TAT, respectively. The highest value illustrated the highest expression level in each cell type. (B) Correlation of TAM numbers in ascites (CD14+ cells/ml) with the level of different soluble mediators in ascites determined by ELISA (Spearman rho; n = 17 patients). (C) Kaplan-Meier analysis of CXCL9 ascites levels as in panel A. Samples were dichotomized at the lower tercile (q = 0.3) as indicated. p: logrank p-value; HR: hazard ratio; rfs: RFS for high versus low levels; inf: infinite (> 56 months). (D) Association of the expression of CXCL and CXCR3 genes in tumor tissue with the overall survival (OS) of ovarian cancer patients. Data were retrieved from the PRECOG database (https://precog.stanford.edu). z-score <2 (blue): significant association with OS; z-score >2 (red): inverse association with OS; (E) Model depicting regulation of TEM migration into the ovarian cancer environment by TAM and association of TEM accumulation in ascites with prolonged RFS. TAM produce chemokines CXCL9, CXCL10 and CXCL11, which attract CXCR3 expressing TEM cells from the periphery, possible in concert with other mediators (dashed arrow). The TEM cells migrating into the TME contribute to tumor eradication and a longer survival.
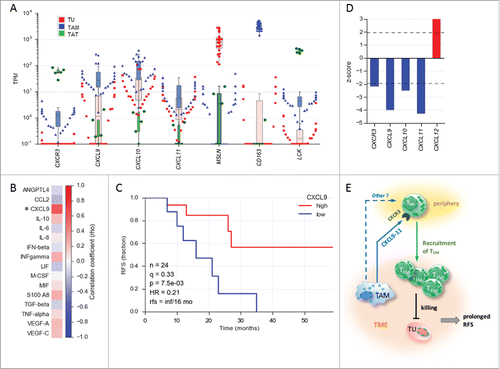
Figure 2. Association of CXCL9 levels in ovarian cancer ascites with relapse-free survival (RFS). (A) Expression of the genes encoding CXCR3 and its ligands CXCL9, CXCL10 and CXCL11 in tumor cells (TU) depicted in red, tumor-associated macrophages (TAM) depicted in blue and tumor-associated T cells (TAT) depicted in green from ovarian cancer ascites (TPM values determined by RNA-Seq). (TU, n = 23; TAM, n = 28; TAT, n = 6). MSLN, CD163 and LCK served as cell-type-specific markers for TU, TAM and TAT, respectively. The highest value illustrated the highest expression level in each cell type. (B) Correlation of TAM numbers in ascites (CD14+ cells/ml) with the level of different soluble mediators in ascites determined by ELISA (Spearman rho; n = 17 patients). (C) Kaplan-Meier analysis of CXCL9 ascites levels as in panel A. Samples were dichotomized at the lower tercile (q = 0.3) as indicated. p: logrank p-value; HR: hazard ratio; rfs: RFS for high versus low levels; inf: infinite (> 56 months). (D) Association of the expression of CXCL and CXCR3 genes in tumor tissue with the overall survival (OS) of ovarian cancer patients. Data were retrieved from the PRECOG database (https://precog.stanford.edu). z-score <2 (blue): significant association with OS; z-score >2 (red): inverse association with OS; (E) Model depicting regulation of TEM migration into the ovarian cancer environment by TAM and association of TEM accumulation in ascites with prolonged RFS. TAM produce chemokines CXCL9, CXCL10 and CXCL11, which attract CXCR3 expressing TEM cells from the periphery, possible in concert with other mediators (dashed arrow). The TEM cells migrating into the TME contribute to tumor eradication and a longer survival.

Figure 3. Patient-specific protein expression in TAT. (A) Proteins splitting ovarian cancer patients into high and low level expression groups (based on LFQ values in TAT determined by MS). Proteins with a > 2-fold difference between the maximum of the “low” group, depicted in green, and the minimum of the “high” group, depicted in purple, are displayed (descending order with the greatest difference on the left). (B) Heatmap showing the correlation (r-values) of expression (LFQ values) for the proteins in panel A. (C) PANTHER functional annotation (gene ontology enrichment analysis) of the proteins identified in panel A. n: number of genes in the respective group. List of the proteins is included in Figure S4. (D) Correlation (Pearson r) of the expression of these proteins in TAT with CD163 expression in TAM. High CD163 expression in TAM is a surrogate marker for a poor clinical outcome.Citation32,Citation37 Asterisks (*) indicate intracellular proteins associated with TCR signaling (“T cell receptor signaling pathway” in panel B). Lactate dehydrogenase A (LDHA) and CD5 served as controls for proteins showing a low fluctuation of expression. The IKBIP and the prolyl hydroxylase P4HB were included for comparison as proteins with a strong positive correlation with CD163 expression in TAM.
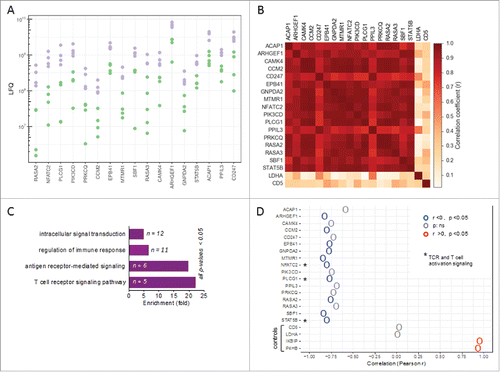
Figure 3. Patient-specific protein expression in TAT. (A) Proteins splitting ovarian cancer patients into high and low level expression groups (based on LFQ values in TAT determined by MS). Proteins with a > 2-fold difference between the maximum of the “low” group, depicted in green, and the minimum of the “high” group, depicted in purple, are displayed (descending order with the greatest difference on the left). (B) Heatmap showing the correlation (r-values) of expression (LFQ values) for the proteins in panel A. (C) PANTHER functional annotation (gene ontology enrichment analysis) of the proteins identified in panel A. n: number of genes in the respective group. List of the proteins is included in Figure S4. (D) Correlation (Pearson r) of the expression of these proteins in TAT with CD163 expression in TAM. High CD163 expression in TAM is a surrogate marker for a poor clinical outcome.Citation32,Citation37 Asterisks (*) indicate intracellular proteins associated with TCR signaling (“T cell receptor signaling pathway” in panel B). Lactate dehydrogenase A (LDHA) and CD5 served as controls for proteins showing a low fluctuation of expression. The IKBIP and the prolyl hydroxylase P4HB were included for comparison as proteins with a strong positive correlation with CD163 expression in TAM.

Figure 4. Ovarian carcinoma ascites suppresses function of CD8+ TEM cells. (A) Flow cytometry analysis of PLCγ1 and transcription factors STAT5B and NFATc2 associated with TCR- and IL-2-signaling in activated CD8+ TEM cells from healthy donors (n = 3). Median fluorescence intensity (MFI) is shown. The gating strategy and histograms are shown in Figure S5. (B, C) Flow cytometry analysis of intracellular TNF-α-positive cells (%) and CD107a (MFI) in activated CD8+ TEM cells from healthy donors (n = 3 per group). The gating strategy and histograms are shown in Figure S6. Statistical analysis by t-test: ***: p < 0.001, **: p < 0.01: *p < 0.05, n.s.: not significant (ascites groups considered as one group with n = 9). (D) A model integrating diverse effects of the ovarian cancer environment on the accumulation and function of CD8+ TEM cells. TAM (and to some extent other cell types) attract CXCR3-expressing TEM cells from the periphery via secretion of CXCL9, CXCL10 and CXCL11 chemokines (and possibly other mediators). However, once migrated into the tumor microenvironment (TME) the activation and function of these TEM cells is suppressed by mediators of tumor environment, thus causing shortened RFS of patients. This is in part mediated by lowering the expression levels of signal transduction proteins crucial for T cell activation.
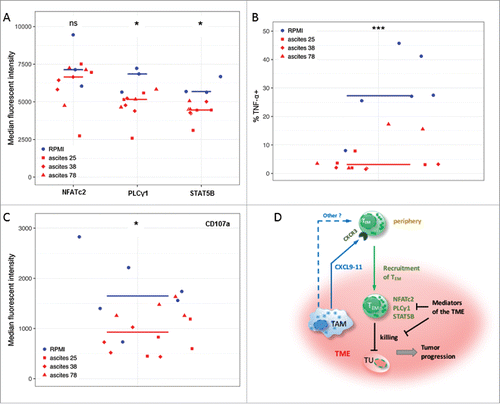
Figure 4. Ovarian carcinoma ascites suppresses function of CD8+ TEM cells. (A) Flow cytometry analysis of PLCγ1 and transcription factors STAT5B and NFATc2 associated with TCR- and IL-2-signaling in activated CD8+ TEM cells from healthy donors (n = 3). Median fluorescence intensity (MFI) is shown. The gating strategy and histograms are shown in Figure S5. (B, C) Flow cytometry analysis of intracellular TNF-α-positive cells (%) and CD107a (MFI) in activated CD8+ TEM cells from healthy donors (n = 3 per group). The gating strategy and histograms are shown in Figure S6. Statistical analysis by t-test: ***: p < 0.001, **: p < 0.01: *p < 0.05, n.s.: not significant (ascites groups considered as one group with n = 9). (D) A model integrating diverse effects of the ovarian cancer environment on the accumulation and function of CD8+ TEM cells. TAM (and to some extent other cell types) attract CXCR3-expressing TEM cells from the periphery via secretion of CXCL9, CXCL10 and CXCL11 chemokines (and possibly other mediators). However, once migrated into the tumor microenvironment (TME) the activation and function of these TEM cells is suppressed by mediators of tumor environment, thus causing shortened RFS of patients. This is in part mediated by lowering the expression levels of signal transduction proteins crucial for T cell activation.
Supplemental material

2017ONCOIMM0763R-file002.xlsx

Download MS Excel (17.2 KB)

2017ONCOIMM0763R-f06-z-bw.docx

Download MS Word (15.1 KB)

2017ONCOIMM0763R-f05-z-4c.pptx

Download MS Power Point (533.2 KB)