2,451
Views
31
CrossRef citations to date
0
Altmetric
Original Research

Bacterial ghosts as adjuvant to oxaliplatin chemotherapy in colorectal carcinomatosis

ORCID Icon, , , , , , , ORCID Icon, ORCID Icon, , ORCID Icon, , , , , , , & show all
Article: e1424676 | Received 04 Dec 2017, Accepted 29 Dec 2017, Published online: 16 Feb 2018

Figures & data

Figure 1. Impact of BGs on the ICD hallmark induction of oxaliplatin in cell culture. (A) Immunofluorescent staining of CRT (green), membrane stain with wheat germ agglutinin (WGA, magenta) and DAPI nucleic stain of CT26 cells was performed after short term treatment (4 h) with oxaliplatin (oxali) and 500 BGs/cell. Representative confocal microphotographs at a magnification of 400x are shown. (B) Quantification of the cell number positive for CRT on the surface relative to the total number of cells, as well as (C) the amount of CRT spots per cell, was performed by counting. A minimum of 50 cells per treatment were counted. (D, E) CT26 cells were treated with the indicated agents and supernatants collected after the indicated incubation times. Subsequently, (D) ATP and (E) HMGB1 release was determined by a luminescent ATP detection assay or an ELISA kit, respectively. Data are represented as mean value ± S.D. of quadruplicates of one representative experiment. Statistical significance was calculated by one-way ANOVA and Bonferroni posttest * p < 0.05; **p < 0.01, significantly different from control.
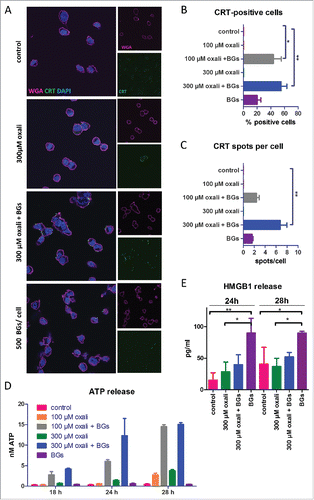
Figure 1. Impact of BGs on the ICD hallmark induction of oxaliplatin in cell culture. (A) Immunofluorescent staining of CRT (green), membrane stain with wheat germ agglutinin (WGA, magenta) and DAPI nucleic stain of CT26 cells was performed after short term treatment (4 h) with oxaliplatin (oxali) and 500 BGs/cell. Representative confocal microphotographs at a magnification of 400x are shown. (B) Quantification of the cell number positive for CRT on the surface relative to the total number of cells, as well as (C) the amount of CRT spots per cell, was performed by counting. A minimum of 50 cells per treatment were counted. (D, E) CT26 cells were treated with the indicated agents and supernatants collected after the indicated incubation times. Subsequently, (D) ATP and (E) HMGB1 release was determined by a luminescent ATP detection assay or an ELISA kit, respectively. Data are represented as mean value ± S.D. of quadruplicates of one representative experiment. Statistical significance was calculated by one-way ANOVA and Bonferroni posttest * p < 0.05; **p < 0.01, significantly different from control.

Figure 2. Synergistic antitumor activity of BGs with oxaliplatin in the murine carcinosis model CT26. (A) Male BALB/c mice were injected i.p. with 1 × 10⁵ CT26 cells on day 0 (D0) and treated according to TS1 (n = 4 per group). (B) On day 10 mice were dissected, the tumors visually identified, collected and weighed. Statistical significance was calculated by nonparametric one-way ANOVA and Bonferroni posttest (* p < 0.05, significantly different from solvent group). (C) In a follow-up experiment, mice were treated with TS1 and dissection was performed on day 13. Median tumor and spleen weights were evaluated. Statistical significance was calculated by unpaired t test (** p < 0.01). (D) The second, another treatment group continued therapy as shown in TS2. (E) In these animals, treatment resulted in significantly prolonged survival (**p < 0.01 calculated by Log-rank test and Mantel-Cox posttest). One of the animals experienced complete remission. This cured mouse was subsequently rechallenged i.p. with CT26 cells (1 × 10⁵) on day 80 (indicated by the arrow).
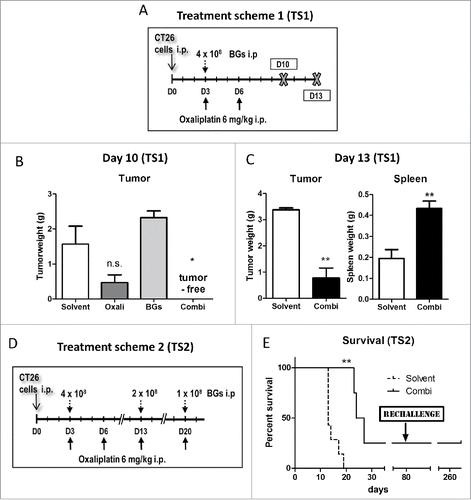
Figure 2. Synergistic antitumor activity of BGs with oxaliplatin in the murine carcinosis model CT26. (A) Male BALB/c mice were injected i.p. with 1 × 10⁵ CT26 cells on day 0 (D0) and treated according to TS1 (n = 4 per group). (B) On day 10 mice were dissected, the tumors visually identified, collected and weighed. Statistical significance was calculated by nonparametric one-way ANOVA and Bonferroni posttest (* p < 0.05, significantly different from solvent group). (C) In a follow-up experiment, mice were treated with TS1 and dissection was performed on day 13. Median tumor and spleen weights were evaluated. Statistical significance was calculated by unpaired t test (** p < 0.01). (D) The second, another treatment group continued therapy as shown in TS2. (E) In these animals, treatment resulted in significantly prolonged survival (**p < 0.01 calculated by Log-rank test and Mantel-Cox posttest). One of the animals experienced complete remission. This cured mouse was subsequently rechallenged i.p. with CT26 cells (1 × 10⁵) on day 80 (indicated by the arrow).

Figure 3. Enhanced efficacy of repeated combination treatment. (A) Female BALB/c mice were injected i.p. with 1 × 10⁵ CT26 cells on day 0 (D0) and treated according to TS3 (n = 7 per group). After one or two cycles of therapy, mice were dissected on day 17 and tumor weight assessed. (B) Pictures of the collected tumor tissues are shown (one of the solvent-treated animals died on day 16, thus no tumors were available here; ✓ marks tumor-free mice). (C) Individual and median tumor weights per treatment group are plotted. Statistical significance was calculated by nonparametric one-way ANOVA and Bonferroni posttest (***p < 0.001, as compared to solvent group). (D) Female C57 BL/6 mice were injected i.p. with 1 × 10⁶ ID8 cells and treated according to TS3 with two therapy cycles (n = 4 per group). The experiment was terminated on day 35 and the intraperitoneal fat tissue containing the small tumor lesions was collected, histologically reprocessed, and H&E-stained. Number of tumor nodules was evaluated from stained slides by counting. In addition, tumor area was digitally measured from scanned H&E-stained slides using Panoramic Viewer Software. Statistical significance was calculated by unpaired t test (* p < 0.05, as compared to solvent group).
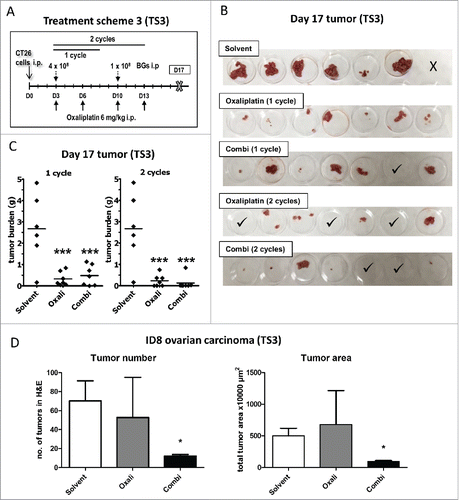
Figure 3. Enhanced efficacy of repeated combination treatment. (A) Female BALB/c mice were injected i.p. with 1 × 10⁵ CT26 cells on day 0 (D0) and treated according to TS3 (n = 7 per group). After one or two cycles of therapy, mice were dissected on day 17 and tumor weight assessed. (B) Pictures of the collected tumor tissues are shown (one of the solvent-treated animals died on day 16, thus no tumors were available here; ✓ marks tumor-free mice). (C) Individual and median tumor weights per treatment group are plotted. Statistical significance was calculated by nonparametric one-way ANOVA and Bonferroni posttest (***p < 0.001, as compared to solvent group). (D) Female C57 BL/6 mice were injected i.p. with 1 × 10⁶ ID8 cells and treated according to TS3 with two therapy cycles (n = 4 per group). The experiment was terminated on day 35 and the intraperitoneal fat tissue containing the small tumor lesions was collected, histologically reprocessed, and H&E-stained. Number of tumor nodules was evaluated from stained slides by counting. In addition, tumor area was digitally measured from scanned H&E-stained slides using Panoramic Viewer Software. Statistical significance was calculated by unpaired t test (* p < 0.05, as compared to solvent group).

Figure 4. Longitudinal evaluation of treatment response in vivo using CT26F-luc cells. Male BALB/c mice were injected i.p. with 1 × 10⁵ CT26F-luc cells on day 0 (D0) and treated according to TS2 (n = 3 per group). Following s.c. luciferin injection, DLIT/µCT was performed to evaluate tumor burden on the indicated days during treatment. (A) One representative animal is depicted for each treatment showing the overlay of the individual tumor nodules as 3D-luminescent signals (in photons per second) with the µCT scans (red arrows highlight tumor nodules responding to therapy). (B) OS of the treated mice is shown as a Kaplan Meier curve. Statistical significance was calculated by Log-rank test together with Cox Mantle posttest (* p < 0.05). Of note, the combination-treated animal #9 died during drug application on day 6. (C) Histological evaluation of tumor tissue collected from mouse #9 was done by H&E-stain. Infiltration of small, densely packed lymphocytes with a high nuclear/cytoplasmic ratio into two tumor nodules is shown (4x and 10x magnification).
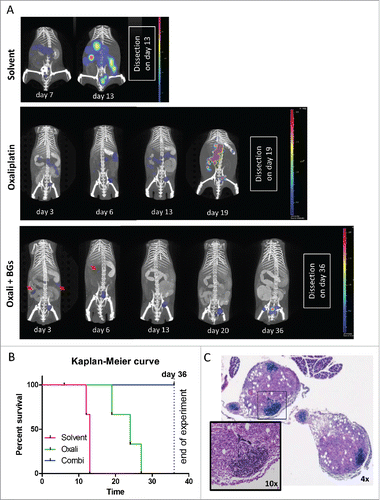
Figure 4. Longitudinal evaluation of treatment response in vivo using CT26F-luc cells. Male BALB/c mice were injected i.p. with 1 × 10⁵ CT26F-luc cells on day 0 (D0) and treated according to TS2 (n = 3 per group). Following s.c. luciferin injection, DLIT/µCT was performed to evaluate tumor burden on the indicated days during treatment. (A) One representative animal is depicted for each treatment showing the overlay of the individual tumor nodules as 3D-luminescent signals (in photons per second) with the µCT scans (red arrows highlight tumor nodules responding to therapy). (B) OS of the treated mice is shown as a Kaplan Meier curve. Statistical significance was calculated by Log-rank test together with Cox Mantle posttest (* p < 0.05). Of note, the combination-treated animal #9 died during drug application on day 6. (C) Histological evaluation of tumor tissue collected from mouse #9 was done by H&E-stain. Infiltration of small, densely packed lymphocytes with a high nuclear/cytoplasmic ratio into two tumor nodules is shown (4x and 10x magnification).

Figure 5. Impact of the combination treatment on the immune cells in tumor and spleen tissue. (A) Male BALB/c mice were injected i.p. with 1 × 10⁵ CT26 cells on day 0 (D0) and treated according to TS3 (n = 4 per group). Animals were sacrificed on day 11 and tumor as well as spleen tissue collected. Statistical significance of the impact of combination treatment was calculated by unpaired t test (***p < 0.001). (B) Impact of treatment on tumor-associated activated cytotoxic T-cells (CD25+) was analysed by flow cytometry. In addition, representative dot plots from each group are shown. (C) Therapy-induced changes on NK-T cells (CD335+/CD3+), granulocytes (CD11b+/Ly6G+) and active macrophages (F4/80+/MHCII+) in tumor vs. spleen tissue were evaluated by multicolor flow cytometry. Each point represents one individual mouse. Statistical analysis was done using unpaired t test (*p < 0.05;**p < 0.01; ***p < 0.001).
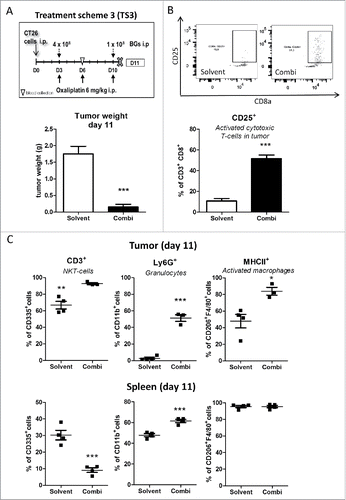
Figure 5. Impact of the combination treatment on the immune cells in tumor and spleen tissue. (A) Male BALB/c mice were injected i.p. with 1 × 10⁵ CT26 cells on day 0 (D0) and treated according to TS3 (n = 4 per group). Animals were sacrificed on day 11 and tumor as well as spleen tissue collected. Statistical significance of the impact of combination treatment was calculated by unpaired t test (***p < 0.001). (B) Impact of treatment on tumor-associated activated cytotoxic T-cells (CD25+) was analysed by flow cytometry. In addition, representative dot plots from each group are shown. (C) Therapy-induced changes on NK-T cells (CD335+/CD3+), granulocytes (CD11b+/Ly6G+) and active macrophages (F4/80+/MHCII+) in tumor vs. spleen tissue were evaluated by multicolor flow cytometry. Each point represents one individual mouse. Statistical analysis was done using unpaired t test (*p < 0.05;**p < 0.01; ***p < 0.001).

Figure 6. Effect of CD8+ cells depletion on activity of combination treatment. (A) Male BALB/c mice were injected i.p. with 1 × 10⁵ CT26 cells on day 0 (D0) and treated according to the modified TS3 (n = 4 per group). Blood samples were taken on day 6 and mice were dissected on day 13. (B) Impact of treatment on cytotoxic T-cells (CD8+) was verified in blood samples, by flow cytometry. Representative dot plots and (C) quantification as fraction of CD8+ cells in CD3+ population are shown. (D) Tumor burden is plotted as mean ± SD. Statistical significance was calculated by unpaired t test (*p < 0.05;**p < 0.01;***p < 0.001)
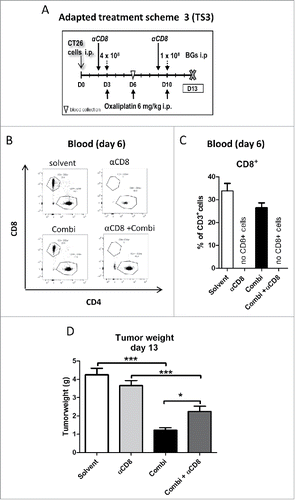
Figure 6. Effect of CD8+ cells depletion on activity of combination treatment. (A) Male BALB/c mice were injected i.p. with 1 × 10⁵ CT26 cells on day 0 (D0) and treated according to the modified TS3 (n = 4 per group). Blood samples were taken on day 6 and mice were dissected on day 13. (B) Impact of treatment on cytotoxic T-cells (CD8+) was verified in blood samples, by flow cytometry. Representative dot plots and (C) quantification as fraction of CD8+ cells in CD3+ population are shown. (D) Tumor burden is plotted as mean ± SD. Statistical significance was calculated by unpaired t test (*p < 0.05;**p < 0.01;***p < 0.001)
Supplemental material

Groza_et_al._Supplementary_Figures_proof_read.pptx

Download MS Power Point (13.3 MB)

2017ONCOIMM0988-file004.docx

Download MS Word (12.3 KB)

Reprints and Corporate Permissions

Please note: Selecting permissions does not provide access to the full text of the article, please see our help page How do I view content?

To request a reprint or corporate permissions for this article, please click on the relevant link below:

Academic Permissions

Please note: Selecting permissions does not provide access to the full text of the article, please see our help page How do I view content?

Obtain permissions instantly via Rightslink by clicking on the button below:

If you are unable to obtain permissions via Rightslink, please complete and submit this Permissions form. For more information, please visit our Permissions help page.