2,839
Views
38
CrossRef citations to date
0
Altmetric
Original Research

CD96 targeted antibodies need not block CD96-CD155 interactions to promote NK cell anti-metastatic activity

, , , ORCID Icon, , ORCID Icon, ORCID Icon, , & show all
Article: e1424677 | Received 02 Jan 2018, Accepted 03 Jan 2018, Published online: 01 Feb 2018

Figures & data

Figure 1. Anti- mCD96 mAbs bind different Ig domains of the CD96 molecule. Octet binding profiles of (A) 3.3, (B) 6A6 and (C) 8B10 anti-CD96 mAbs to recombinant CD96. (D) Relative binding of anti-mCD96 mAbs (3.3, 6A6 and 8B10) to mouse/human CD96 three domain chimeric molecules (M = mouse and H = human) expressed in HEK-293 cells as measured by flow cytometry where binding to mouse CD96 is standardized as 100%. Relative binding curves of mCD155-Fc (3 μg/ml) binding to HEK-293 cells transfected with mCD96 in the presence of various dilutions (log concentration shown starting at 100 μg/ml) (E) 3.3 and 6A6 mAbs and (F) 8B10 mAb as indicated.
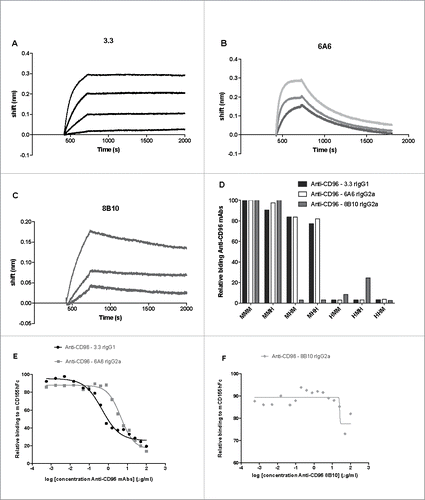
Figure 1. Anti- mCD96 mAbs bind different Ig domains of the CD96 molecule. Octet binding profiles of (A) 3.3, (B) 6A6 and (C) 8B10 anti-CD96 mAbs to recombinant CD96. (D) Relative binding of anti-mCD96 mAbs (3.3, 6A6 and 8B10) to mouse/human CD96 three domain chimeric molecules (M = mouse and H = human) expressed in HEK-293 cells as measured by flow cytometry where binding to mouse CD96 is standardized as 100%. Relative binding curves of mCD155-Fc (3 μg/ml) binding to HEK-293 cells transfected with mCD96 in the presence of various dilutions (log concentration shown starting at 100 μg/ml) (E) 3.3 and 6A6 mAbs and (F) 8B10 mAb as indicated.

Figure 2. Dose response of anti-CD96 mAbs, against B16F10 experimental lung metastases. WT mice were injected i.v. with B16F10 melanoma (1 × 10⁵ cells). On day 0 and 3 after tumor inoculation, mice were treated with i.p. injections of cIg (250 μg) or various doses of anti-CD96 mAb (A) 6A6 (rat IgG2a) and (B) 8B10 (rat IgG2a) as indicated. The cIg group shown is common to parts A and B. The metastatic burden was quantified in the lungs after 14 days by counting colonies on the lung surface. Individual mice are represented by each symbol and means ± SEM of 5 mice per group are shown. Significant differences between groups as indicated by crossbars were determined by a one-way ANOVA with post Tukey test (*: p < 0.05, **:p < 0.01, ****: p < 0.0001).
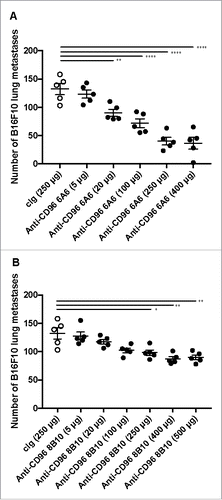
Figure 2. Dose response of anti-CD96 mAbs, against B16F10 experimental lung metastases. WT mice were injected i.v. with B16F10 melanoma (1 × 10⁵ cells). On day 0 and 3 after tumor inoculation, mice were treated with i.p. injections of cIg (250 μg) or various doses of anti-CD96 mAb (A) 6A6 (rat IgG2a) and (B) 8B10 (rat IgG2a) as indicated. The cIg group shown is common to parts A and B. The metastatic burden was quantified in the lungs after 14 days by counting colonies on the lung surface. Individual mice are represented by each symbol and means ± SEM of 5 mice per group are shown. Significant differences between groups as indicated by crossbars were determined by a one-way ANOVA with post Tukey test (*: p < 0.05, **:p < 0.01, ****: p < 0.0001).

Figure 3. Anti-CD96 mAbs differentially suppress experimental lung metastasis. Comparative activities of various anti-CD96 mAbs against various experimental lung metastases. Groups of 5–10 C57BL/6 or BALB/c WT were injected i.v. with (A) B16F10 melanoma (1 × 10⁵cells), (B) LWT1 melanoma (5 × 10⁵ cells), (C) RM-1 prostate carcinoma (5 × 10⁴ cells), or (D) CT26 colon adenocarcinoma (5 × 10⁵ cells). On days 0 and 3 after tumor inoculation, mice were treated with i.p. injections of cIg (400 μg), anti-CD96 mAb 3.3 (250 μg, rat IgG1), 6A6 (250 or 400 μg, rat IgG2a), or 8B10 (400 μg, rat IgG2a), as indicated. The metastatic burden was quantified in the lungs after 14 days by counting colonies on the lung surface. Individual mice are represented by each symbol and means ± SEM of 5–10 mice per group are shown. Significant differences between groups as indicated by crossbars were determined by a one-way ANOVA with post Tukey test (*: p < 0.05, **: p < 0.01, ***: p < 0.001; ****: p < 0.0001). Part of panel A has already been published in Cancer Discovery articleCitation4.
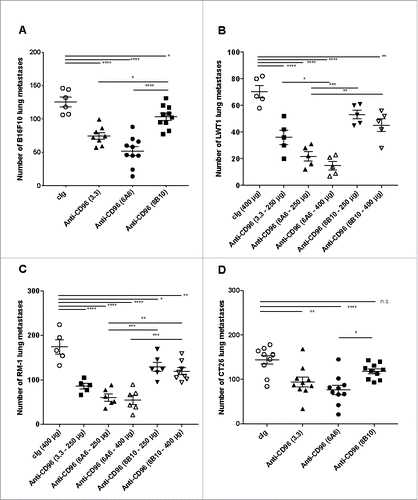
Figure 3. Anti-CD96 mAbs differentially suppress experimental lung metastasis. Comparative activities of various anti-CD96 mAbs against various experimental lung metastases. Groups of 5–10 C57BL/6 or BALB/c WT were injected i.v. with (A) B16F10 melanoma (1 × 10⁵cells), (B) LWT1 melanoma (5 × 10⁵ cells), (C) RM-1 prostate carcinoma (5 × 10⁴ cells), or (D) CT26 colon adenocarcinoma (5 × 10⁵ cells). On days 0 and 3 after tumor inoculation, mice were treated with i.p. injections of cIg (400 μg), anti-CD96 mAb 3.3 (250 μg, rat IgG1), 6A6 (250 or 400 μg, rat IgG2a), or 8B10 (400 μg, rat IgG2a), as indicated. The metastatic burden was quantified in the lungs after 14 days by counting colonies on the lung surface. Individual mice are represented by each symbol and means ± SEM of 5–10 mice per group are shown. Significant differences between groups as indicated by crossbars were determined by a one-way ANOVA with post Tukey test (*: p < 0.05, **: p < 0.01, ***: p < 0.001; ****: p < 0.0001). Part of panel A has already been published in Cancer Discovery articleCitation4.

Figure 4. Anti-CD96 mAbs differentially suppress spontaneous metastasis. Groups of 5–10 BALB/c WT mice were injected with 5 × 10⁴ 4T1.2 mammary carcinoma cells into the mammary fat pad. Some groups of mice were treated i.p. on days 12 and 14 after tumor inoculation with neoadjuvant cIg (400 μg), anti-CD96 mAb 3.3 (400 μg, rat IgG1), 6A6 (400 μg, rat IgG2a), 8B10 (400 μg, rat IgG2a), or anti-PD-1 (RMP1-14, 250 μg) as indicated. On days 16 all primary tumors were resected. (A) Some cohorts were sacrificed on day 34 and the metastatic burden was quantified in the lungs by counting colonies on the lung surface. Individual mice are represented by each symbol and means ± SEM of 5 mice per group are shown. Significant differences between groups as indicated by crossbars were determined by a one-way ANOVA with post Tukey test (*: p < 0.05, **: p < 0.01, ***: p < 0.001). (B) Other mice were monitored for survival. The Kaplan-Meier curves for overall survival of each group are shown. Significant differences between indicated groups were determined by log-rank sum test with exact p values shown.
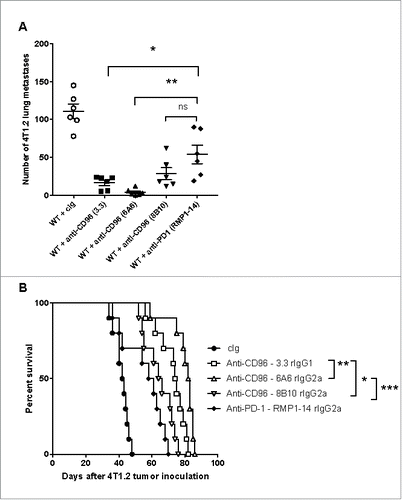
Figure 4. Anti-CD96 mAbs differentially suppress spontaneous metastasis. Groups of 5–10 BALB/c WT mice were injected with 5 × 10⁴ 4T1.2 mammary carcinoma cells into the mammary fat pad. Some groups of mice were treated i.p. on days 12 and 14 after tumor inoculation with neoadjuvant cIg (400 μg), anti-CD96 mAb 3.3 (400 μg, rat IgG1), 6A6 (400 μg, rat IgG2a), 8B10 (400 μg, rat IgG2a), or anti-PD-1 (RMP1-14, 250 μg) as indicated. On days 16 all primary tumors were resected. (A) Some cohorts were sacrificed on day 34 and the metastatic burden was quantified in the lungs by counting colonies on the lung surface. Individual mice are represented by each symbol and means ± SEM of 5 mice per group are shown. Significant differences between groups as indicated by crossbars were determined by a one-way ANOVA with post Tukey test (*: p < 0.05, **: p < 0.01, ***: p < 0.001). (B) Other mice were monitored for survival. The Kaplan-Meier curves for overall survival of each group are shown. Significant differences between indicated groups were determined by log-rank sum test with exact p values shown.

Figure 5. Anti-CD96 mAb suppression of metastases is not dependent on Fc function. Groups of 4–8 C57BL/6 WT or various FcR-deficient mice (FcγRIII, FcγRIV or Fcϵγ) were injected i.v. with B16F10 melanoma (1 × 10⁵cells). On days 0 and 3 after tumor inoculation, mice were treated with i.p. injections of (A-C) cIg (250 or 400 μg), (A) anti-CD96 mAb 3.3 (250 μg, rat IgG1), (B) 6A6 (250 μg, rat IgG2a), or (C) 8B10 (400 μg, rat IgG2a) as indicated. (D) Groups of 5 C57BL/6 WT mice were injected i.v. with B16F10 melanoma (2 × 10⁵cells). On days 0 and 3 after tumor inoculation, mice were treated with 250 μg i.p. injections of cIg (rat G1), 3.3 (rat IgG1), 3.3 (mouse IgG1), 3.3 (mouse IgG1 D265A), or 3.3 (mouse IgG2a). The metastatic burden was quantified in the lungs after 14 days by counting colonies on the lung surface. Individual mice are represented by each symbol and means ± SEM of 4–8 mice per group are shown. Significant differences between groups as indicated by crossbars were determined by a one-way ANOVA with post Tukey test (*: p < 0.05, **: p < 0.01, ***: p < 0.001).

Figure 5. Anti-CD96 mAb suppression of metastases is not dependent on Fc function. Groups of 4–8 C57BL/6 WT or various FcR-deficient mice (FcγRIII, FcγRIV or Fcϵγ) were injected i.v. with B16F10 melanoma (1 × 10⁵cells). On days 0 and 3 after tumor inoculation, mice were treated with i.p. injections of (A-C) cIg (250 or 400 μg), (A) anti-CD96 mAb 3.3 (250 μg, rat IgG1), (B) 6A6 (250 μg, rat IgG2a), or (C) 8B10 (400 μg, rat IgG2a) as indicated. (D) Groups of 5 C57BL/6 WT mice were injected i.v. with B16F10 melanoma (2 × 10⁵cells). On days 0 and 3 after tumor inoculation, mice were treated with 250 μg i.p. injections of cIg (rat G1), 3.3 (rat IgG1), 3.3 (mouse IgG1), 3.3 (mouse IgG1 D265A), or 3.3 (mouse IgG2a). The metastatic burden was quantified in the lungs after 14 days by counting colonies on the lung surface. Individual mice are represented by each symbol and means ± SEM of 4–8 mice per group are shown. Significant differences between groups as indicated by crossbars were determined by a one-way ANOVA with post Tukey test (*: p < 0.05, **: p < 0.01, ***: p < 0.001).

Figure 6. Anti-CD96 suppression of experimental lung metastasis depends upon NK cells, CD96 and IFN-γ. C57BL/6 WT and CD96-deficient mice (Cd96−/−) mice as indicated were injected i.v with B16F10 melanoma (2 × 10⁵cells). On days 0 and 3 after tumor inoculation, mice were treated with i.p. injections of (A, B) cIg (250 μg) or anti-CD96 mAbs (A) 6A6 (250 μg) or (B) 8B10 (250 μg). Some groups of mice were treated i.p. on days −1, 0 and 7 after tumor inoculation with cIg (100 μg), anti-asGM1 (50 μg) or anti-IFN-γ (250 μg). The metastatic burden was quantified in the lungs after 14 days by counting colonies on the lung surface. Mean ± SEM of 5 mice per group are shown. A and B were the same experiment and some of the cIg and anti-asGM1 treated control groups are replicated in each panel for visual display. Significant differences between groups as indicated by crossbars were determined by a one-way ANOVA with post Tukey test (*: p < 0.05, **: p < 0.01, ****: p < 0.0001).
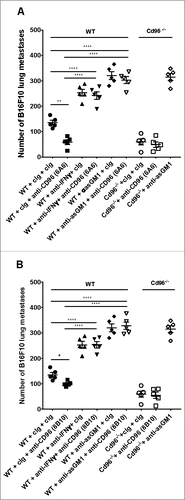
Figure 6. Anti-CD96 suppression of experimental lung metastasis depends upon NK cells, CD96 and IFN-γ. C57BL/6 WT and CD96-deficient mice (Cd96−/−) mice as indicated were injected i.v with B16F10 melanoma (2 × 10⁵cells). On days 0 and 3 after tumor inoculation, mice were treated with i.p. injections of (A, B) cIg (250 μg) or anti-CD96 mAbs (A) 6A6 (250 μg) or (B) 8B10 (250 μg). Some groups of mice were treated i.p. on days −1, 0 and 7 after tumor inoculation with cIg (100 μg), anti-asGM1 (50 μg) or anti-IFN-γ (250 μg). The metastatic burden was quantified in the lungs after 14 days by counting colonies on the lung surface. Mean ± SEM of 5 mice per group are shown. A and B were the same experiment and some of the cIg and anti-asGM1 treated control groups are replicated in each panel for visual display. Significant differences between groups as indicated by crossbars were determined by a one-way ANOVA with post Tukey test (*: p < 0.05, **: p < 0.01, ****: p < 0.0001).

Figure 7. Anti-CD96 8B10 mAbs protects from metastases in the absence of CD155 and IL-12p35. (A) Groups of C57BL/6 WT or CD155-deficient (Cd155−/−) mice were injected i.v. with B16F10 melanoma (1 × 10⁵ cells). On days 0 and 3 after tumor inoculation, mice were treated with i.p. injections of anti-CD96 3.3 mAb (rat IgG1, 250 μg), 6A6 mAb (rat IgG2a, 250 μg), and 8B10 mAb (rat IgG2a, 250 μg) or the equivalent amount of cIg (250 μg). (B) Groups of C57BL/6 WT or IL-12p35-deficient (IL-12p35−/−) mice were injected i.v. with B16F10 melanoma (2 × 10⁵ cells). On days 0 and 3 after tumor inoculation, mice were treated with i.p. injections of anti-CD96 3.3 mAb (rat IgG1, 250 μg), 6A6 mAb (rat IgG2a, 250 μg), and 8B10 mAb (rat IgG2a, 250 μg) or the equivalent amount of cIg (250 μg). (C) Groups of C57BL/6 WT or Cd226-deficient (Cd226−/−) mice were injected i.v. with B16F10 melanoma (5 × 10⁵ cells). On days 0 and 3 after tumor inoculation, mice were treated with i.p. injections of anti-CD96 3.3 mAb (rat IgG1, 250 μg), 6A6 mAb (rat IgG2a, 250 μg), and 8B10 mAb (rat IgG2a, 250 μg) or the equivalent amount of cIg (250 μg). The metastatic burden was quantified in the lungs after 14 days by counting colonies on the lung surface. Mean ± SEM of 5–6 mice per group are shown. Significant differences between groups as indicated by crossbars were determined by a one-way ANOVA with post Tukey test (*: p < 0.05, **: p < 0.01, ***: p < 0.001; ****: p < 0.0001).

Figure 7. Anti-CD96 8B10 mAbs protects from metastases in the absence of CD155 and IL-12p35. (A) Groups of C57BL/6 WT or CD155-deficient (Cd155−/−) mice were injected i.v. with B16F10 melanoma (1 × 10⁵ cells). On days 0 and 3 after tumor inoculation, mice were treated with i.p. injections of anti-CD96 3.3 mAb (rat IgG1, 250 μg), 6A6 mAb (rat IgG2a, 250 μg), and 8B10 mAb (rat IgG2a, 250 μg) or the equivalent amount of cIg (250 μg). (B) Groups of C57BL/6 WT or IL-12p35-deficient (IL-12p35−/−) mice were injected i.v. with B16F10 melanoma (2 × 10⁵ cells). On days 0 and 3 after tumor inoculation, mice were treated with i.p. injections of anti-CD96 3.3 mAb (rat IgG1, 250 μg), 6A6 mAb (rat IgG2a, 250 μg), and 8B10 mAb (rat IgG2a, 250 μg) or the equivalent amount of cIg (250 μg). (C) Groups of C57BL/6 WT or Cd226-deficient (Cd226−/−) mice were injected i.v. with B16F10 melanoma (5 × 10⁵ cells). On days 0 and 3 after tumor inoculation, mice were treated with i.p. injections of anti-CD96 3.3 mAb (rat IgG1, 250 μg), 6A6 mAb (rat IgG2a, 250 μg), and 8B10 mAb (rat IgG2a, 250 μg) or the equivalent amount of cIg (250 μg). The metastatic burden was quantified in the lungs after 14 days by counting colonies on the lung surface. Mean ± SEM of 5–6 mice per group are shown. Significant differences between groups as indicated by crossbars were determined by a one-way ANOVA with post Tukey test (*: p < 0.05, **: p < 0.01, ***: p < 0.001; ****: p < 0.0001).
Supplemental material

Reprints and Corporate Permissions

Please note: Selecting permissions does not provide access to the full text of the article, please see our help page How do I view content?

To request a reprint or corporate permissions for this article, please click on the relevant link below:

Academic Permissions

Please note: Selecting permissions does not provide access to the full text of the article, please see our help page How do I view content?

Obtain permissions instantly via Rightslink by clicking on the button below:

If you are unable to obtain permissions via Rightslink, please complete and submit this Permissions form. For more information, please visit our Permissions help page.