Figures & data
Figure 1. (A) Schematic representation of mono-mIL12-Fc and bi-mIL12-Fc proteins. (B) Purified mIL12-Fc proteins were analyzed by SDS-PAGE under either a reducing ('R') or non-reducing ('NR') condition. The arrows indicate the eluted position of the proteins. Representative images from three independent experiments are shown. (C) Size exclusion elution profiles of purified mIL12-Fc proteins (100 μL of 500 μg/mL) were monitored at 280 nm. Representative chromatogram from three independent experiments are shown. (D) Binding activities of 1 μM of mIL12-Fc proteins on the surface of resting and PHA-activated PBMCs, determined by flow cytometric analysis. Representative histograms from three independent experiments are shown. (E) Proliferation of PHA-activated PBMCs after 72-h culture with the indicated concentrations of proteins, presented in the equimolar concentration of rmIL12. Representative results from three independent experiments performed in triplicates are shown as means ± SD. ***p < 0.001 versus rmIL12 determined by Newman-Keuls multiple comparison post-hoc test. (F) Serum concentrations of mIL12-Fc proteins in non-tumor-bearing Balb/c mice were determined by ELISA following a single intravenous injection of proteins at an equimolar amount to 1 μg of rmIL12 in a total volume of 200 μL. Symbols and error bars represent the mean ± SD (n = 3 per time point). Data shown are representative of two independent experiments. The solid lines represent the fit of a two-compartment pharmacokinetic model to the data to estimate the initial rapid clearance phase (T1/2α) and the later terminal serum clearance phase (T1/2β). The inset table shows the pharmacokinetic parameters.
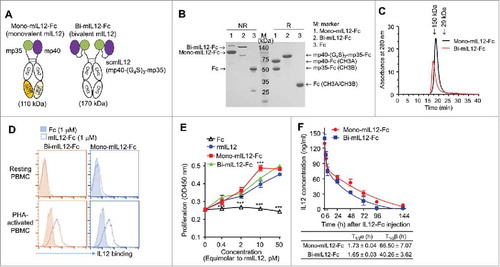
Figure 2. (A) In vivo antitumor efficacy of mIL12-Fc proteins compared to that of PBS, Fc, and rmIL12 controls analyzed in syngeneic Balb/c mice bearing CT26-HER2/neu tumors. Twice-weekly i.p. injection of mIL12-Fc proteins (equivalent molar amount of 1 μg IL12) was initiated 11 days after tumor cell inoculation when the tumors were small (∼100 mm3). (B–E) Antitumor effect of mIL12-Fc proteins on large established CT26-HER2/neu tumors (B, C) and CT26 tumors (D) in syngeneic Balb/c mice, and B16F10 tumors (E) in syngeneic C57BL/6 mice. (B, C) Twice-weekly i.p. injection of mIL12-Fc proteins (equivalent molar amount of 0.1–0.25 μg mIL12 (B) and 0.5–2 μg mIL12 (C)) was initiated 14 days after tumor cell inoculation when the tumors were large (∼300 mm3). (D, E) Twice-weekly i.p. injection of mIL12-Fc proteins (equivalent molar amount of 0.5 and 1 μg mIL12) was initiated 11 days after tumor cell inoculation when the tumors were large (∼300 mm3). In (A–E), symbols and error bars represent means ± SEM of 2–3 pooled (A–C) or representative (D, E) experiments with at least 5 mice/group. *p < 0.05, **p < 0.01, ***p < 0.001 versus rmIL12 (A) or bi-mIL12-Fc (B–E) determined by one-way ANOVA with Newman-Keuls post-hoc test. (F) The effect of mIL12-Fc proteins on the phenotypes and functions of effector cells in CT26-HER2/neu TBM were analyzed as described in a-j on the indicated day after tumor inoculation. The arrows indicate each time point for treatment or assay. In (A–F), the dose of mIL12-Fc proteins is presented as the equivalent molar amount of rmIL12 (μg).
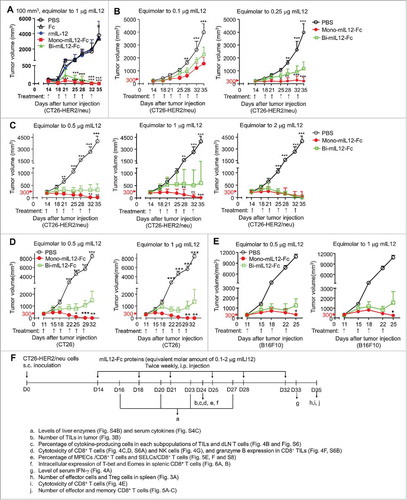
Figure 3. (A) Effect of mIL12-Fc proteins (as described in the legend to ) on the expansion of effector cells and reduction in Treg cells with the indicated lineage markers in the spleens of mice bearing CT26-HER2/neu tumors, analyzed by a hemocytometer and flow cytometry 35 days after tumor inoculation. (B) Effect of mIL12-Fc proteins (as described in ) on the number of indicated immune cells and percentage of Treg cells infiltrated into CT26-HER2/neu tumors in mice, analyzed by flow cytometry with the indicated lineage markers 24 days after tumor inoculation. In (A, B), each symbol represents the value obtained from individual mice, and midlines represent the means of two pooled experiments. **p < 0.01, ***p < 0.001 versus the PBS control group or between the indicated groups determined by one-way ANOVA with Newman-Keuls post-hoc test.
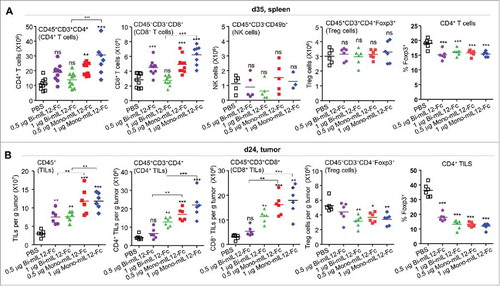
Figure 4. (A) Serum levels of IFN-γ in CT26-HER2/neu TBM treated with mIL12-Fc protein (as described in ), measured by ELISA 33 days after tumor inoculation. (B) Percentages of cytokine-producing cells in each subpopulation of TILs and dLN T cells isolated from mice bearing CT26-HER2/neu tumors, analyzed by flow cytometry 24 days after tumor inoculation. (C–E) Cytotoxic activity of splenic CD8+ T cells isolated from CT26-HER2/neu TBM treated with mIL12-Fc proteins (as described in ), analyzed 24 days (C, D) and 35 days (E) after tumor inoculation, followed by 4 h of culture with calcein-AM-labeled CT26-HER2/neu and 4T1 (control) cells. The percentage of calcein-AM-negative (dead) CT26-HER2/neu and 4T1 cells was measured by flow cytometry. (C) Representative dot plots from two independent experiments. (F) Granzyme B-expressing CD8+ TILs in CT26-HER2/neu TBM treated with mIL12-Fc proteins, analyzed by flow cytometry 24 days after tumor inoculation. (G) Cytotoxicity of NK cells isolated from the spleens of CT26-HER2/neu TMB treated with the indicated mIL12-Fc proteins (as described in ), measured by a calcein-AM release assay on day 24 after tumor inoculation. In (A, B, D–G), each symbol represents the value obtained from individual mice. Midlines represent the means of data compiled from 2–3 independent experiments. *p < 0.05, **p < 0.01, ***p < 0.001 versus the PBS control or between the indicated groups determined by one-way ANOVA with Newman-Keuls post-hoc test.
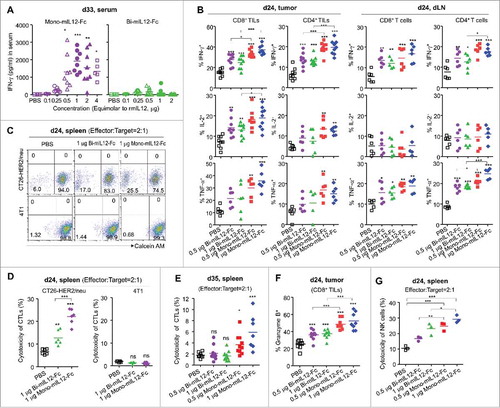
Figure 5. (A–C) Phenotypic analysis of CD8+ T cells with indicated lineage markers in the spleens of CT26-HER2/neu TBM treated with mIL12-Fc proteins (as described in ), analyzed by a hemocytometer and flow cytometry 35 days after tumor inoculation. Effector CD8+ T cells, TEM, and TCM were gated based on CD62L versus IL-7R expression. (D) Mice cured with mono-mIL12-Fc treatment were re-challenged with 106 CT26-HER2/neu tumor cells at 20 weeks after initial tumor inoculation. Tumor growth of re-challenged mice was compared with that of age-matched naïve mice without further treatment. Symbols and error bars represent the means ± SEM of 3 pooled experiments with at least 3 mice/group. ***p < 0.001 versus the PBS control determined by Student's t test. (E, F) Percentage of MPECs and SELCs in splenic CD8+ T cells of CT26-HER2/neu TBM treated with mIL12-Fc proteins (as described in ), analyzed by flow cytometry 24 days after tumor inoculation. SELCs and MPECs were gated based on KLRG1 versus IL-7R expression. (A–C, E, F) Each symbol represents the value obtained from individual mice. Midlines represent the means of data compiled from two independent experiments (A, B) or representing two independent experiments (C, E, F). **p < 0.01, ***p < 0.001 versus the PBS control group determined by one-way ANOVA with Newman-Keuls post-hoc test.
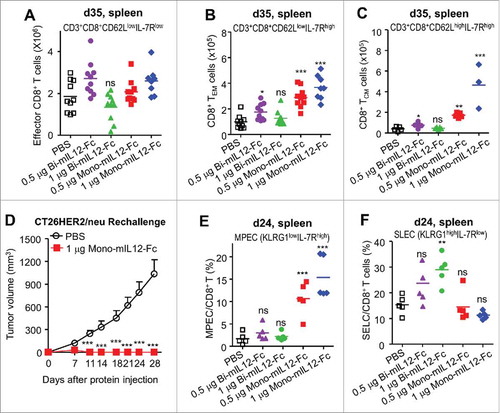
Figure 6. (A, B) Intracellular expression of T-bet and Eomes in splenic CD8+ T cells of CT26-HER2/neu TBM treated with the indicated mIL12-Fc proteins (as described in ), analyzed by flow cytometry 24 days after tumor inoculation. Each symbol represents the value obtained from individual mice. Horizontal bars represent the means of data compiled from two independent experiments. **p < 0.01, ***p < 0.001 versus the PBS control group determined by one-way ANOVA with Newman-Keuls post-hoc test. (C, D) Intracellular expression of pSTAT4 (C) on day 15 and T-bet (D) on day 17 in dLN CD8+ T cells of CT26-HER2/neu TBM after single treatment with the indicated mIL12-Fc proteins (as described in Fig. S4D), analyzed by flow cytometry. Results are depicted as the mean ± SEM compiled from two independent experiments for at least 3 mice/group. ***p < 0.001 versus the PBS control or between the indicated groups by one-way ANOVA with Newman-Keuls post-hoc test. (E, F) Effect of cross-linked mIL12-Fc on the expression of pSTAT4 (E) and T-bet (F) in mouse CD8+ T cells after 2 h (E) or 72 h (F) of culture with plate-bound anti-CD3 antibody (1 μg/mL) and soluble anti-CD28 antibody (0.5 μg/mL) in the presence of 20 pM of mIL12-Fc alone or in combination with anti-Fc antibody at the indicated molar ratios, analyzed by flow cytometry. Results are depicted as the mean ± SEM compiled from two independent experiments. *p < 0.05, ***p < 0.001 versus bi-mIL12-Fc determined by Student's t test.
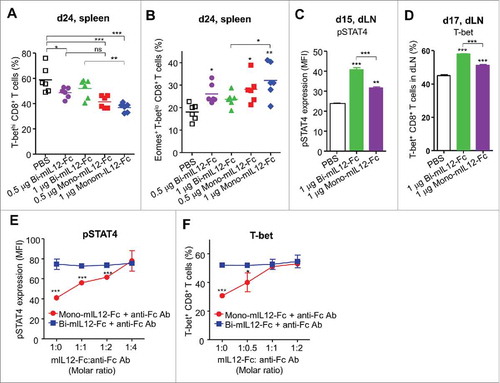
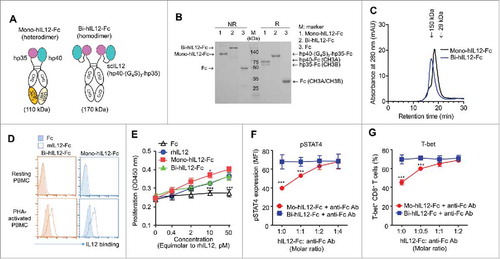
Figure 7. (A) Schematic representation of mono-hIL12-Fc and bi-hIL12-Fc proteins. (B) Purified hIL12-Fc proteins were analyzed by SDS-PAGE under either a reducing ('R') or non-reducing ('NR') condition. The arrows indicate the eluted position of the proteins. Representative images from three independent experiments are shown. (C) Size exclusion elution profiles of purified hIL12-Fc proteins (100 μL of 500 μg/mL) were monitored at 280 nm. Representative chromatogram from three independent experiments are shown. (D) Binding activities of 1 μM of hIL12-Fc proteins on the surface of resting and PHA-activated PBMCs, determined by flow cytometric analysis. (E) Proliferation of PHA-activated PBMCs after 72-h culture with the indicated concentrations of proteins, presented in the equimolar concentration of rhIL12. Representative results from three independent experiments performed in triplicates are shown as the means ± SD. ***p < 0.001 versus rmIL12 determined by Newman-Keuls multiple comparison post-hoc test. (F, G) Effect of cross-linked hIL12-Fc on the expression of pSTAT4 (F) and T-bet (G) in human CD8+ T cells after 2 h (F) or 72 h (G) of culture with plate-bound anti-CD3 antibody (1 μg/mL) and soluble anti-CD28 antibody (0.5 μg/mL) in the presence of 20 pM of hIL12-Fc alone or in combination with anti-Fc antibody at the indicated molar ratios, analyzed by flow cytometry. Results are depicted as the mean ± SEM compiled from two independent experiments. ***p < 0.001 versus bi-hIL12-Fc determined by Student's t test.