
Figures & data
Figure 1. Significant correlation between NTS/IL-8 co-expression and patient prognosis confirmed at the mRNA and protein levels. a. Seventy-one fresh primary HCC tissues were detected via whole-genome expression microarray. The results showed that the majority of samples overexpressing NTS had upregulated IL-8 expression, with a positive correlation between NTS and IL-8. b. NTS and IL-8-positive staining was exclusively detected in the cytoplasm of HCC cells via IHC staining. c. The OS was compared between NTS+ and NTS−, IL-8+ and IL-8−, NTS+IL-8+and non-NTS+IL-8+ patients grouped according to mRNA levels. Although no significant difference was determined between NTS+ and NTS− patients, IL-8+and NTS+IL-8+ HCC patients showed worse prognosis. d. The OS was compared in 100 HCC samples according to the IHC results. NTS+ and NTS+IL-8+ HCC patients had a shorter OS than NTS− and non-NTS+IL-8+ patients respectively, but no significant difference was determined between IL-8+ and IL-8− patients.
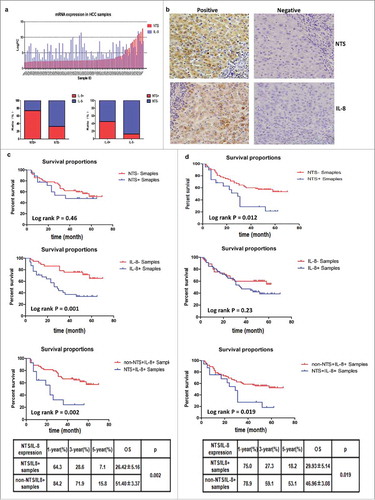
Figure 2. NTS/IL-8 co-expression was associated with enhanced inflammation and EMT features in HCC tissues. Decreased expression levels of E-cadherin and increased levels of N-cadherin on the membrane, and accumulation of β-catenin in the cytoplasm were detected in the NTS+IL-8+ cancer cells, which implied EMT progress. Expression of the invasion biomarker MMP9 was also increased along with two angiogenesis biomarkers, CD31 and VEGF. The infiltration of CD68+, CD163+ cells and CD66b+ cells increased in cancer tissues, representing an increase in M2 TAMs and PMNs.
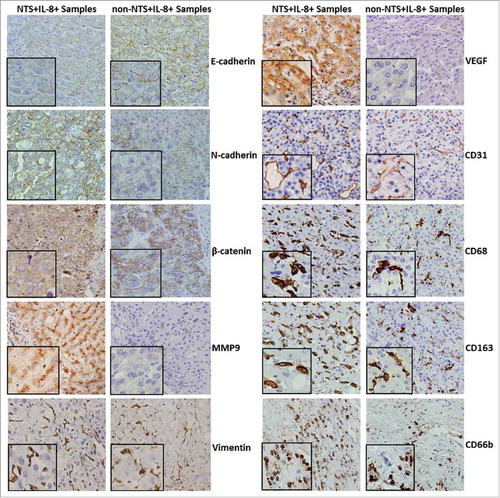
Figure 3. NTS induced the synthesis and secretion of IL-8 in HCC cell lines. a. The secretion of IL-8 was examined in four HCC cell lines with different NTS and NTR1 expression by ELISA. b. The mRNA levels of IL-8 in four HCC cell lines were detected by real-time PCR. c. IL-8 mRNA expression levels of genetically modified Hep3B cells with or without NTS stimulation. d. IL-8 mRNA expression levels of genetically modified HepG2 cells with or without NTS stimulation. e. The secretion of IL-8 in supernatants of Hep3B cells was examined by ELISA. f. The secretion of IL-8 in supernatants of HepG2 cells was examined by ELISA.
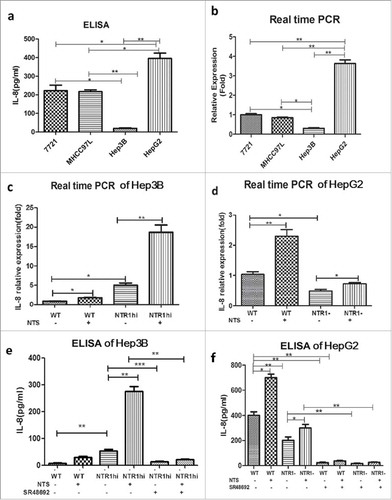
Figure 4. Activation of the NTS/IL-8 pathway enhanced the invasion and migration of HCC cells by promoting EMT. a. Effect of the CXCR1/2-specific antagonist reparixin, which is used for blocking IL-8, on the migration of Hep3Bwt and Hep3BNTR1hi cells was evaluated by a wound-healing assay. Blocking IL-8 signal could reduce the migration of HCC cells with or without NTS stimulation. b. The change of migration function on HepG2 cells was also examined by a wound-healing assay after reparixin blocking, and same result was detected. c. Blocking IL-8 could reduce the invasiveness of Hep3Bwt and Hep3BNTR1hi cells as detected with the Transwell assay. d. The same result was detected for HepG2 cells. e. EMT markers were analyzed in Hep3Bwt and Hep3BNTR1hi cells after reparixin treatment, and reparixin increased the level of E-cadherin remarkably but decreased the levels of N-cadherin and β-catenin significantly. f. The same tendency of the EMT markers was determined in HepG2 cells which indicated reparixin reversed the EMT of HCC cells effectively.
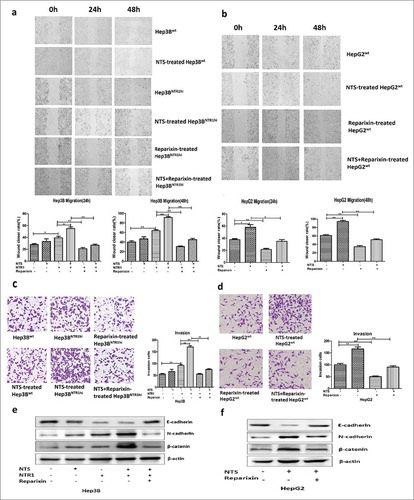
Figure 5. NTS induced IL-8 by activating the MAPK and NF-κB pathways, which are important for the EMT and invasiveness of HCC cells. a. Key proteins along the Ras, MAPK, NF-κB, PKC, and PI3K signaling pathways were examined after NTS treatment, and obvious activation of Ras, p38, ERK, JNK, IκB and p65 proteins was detected which implied that the Ras, MAPK and NF-κB signaling pathways are activated after NTS stimulation. b. After blocking NTR1, the phosphorylation of JNK, ERK, or p38 protein in the MAPK pathway and the phosphorylation of IκB and p65 decreased. c. The activation status of five subunits of the NF-κB family was examined in extracting nuclear proteins, among which p65 and p50 significantly increased after NTS stimulation, but decreased after blocking NTR1. d. The specific antagonists against the MAPK or NF-κB pathway inhibited IL-8 secretion in Hep3BNTR1hi cells. e. Blocking the MAPK pathway or the NF-κB pathway inhibited the migration of Hep3BNTR1hi cells. f. The invasion capacity declined after blocking the MAPK pathway or the NF-κB pathway. g. The specific antagonists against the MAPK or NF-κB pathway could reverse the EMT of HCC cells.
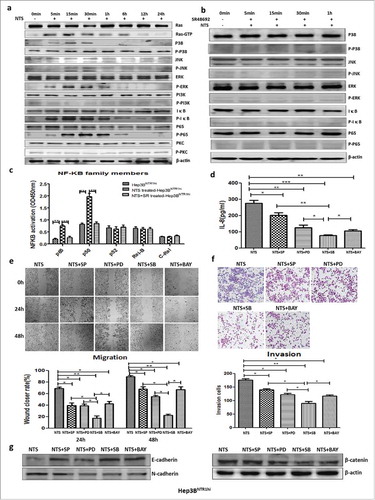
Figure 6. NTS-induced IL-8 activated M2 polarization of TAMs by promoting a phenotypic switch, chemotaxis, and phagocytosis in vitro. a. THP-1 cells were co-cultured with Hep3Bwt or Hep3BNTR1hi cells with or without NTS stimulation. More CD68+ cells and CD163+CD206+ cells were detected in Hep3BNTR1hi cells than in Hep3Bwt cells, but these numbers decreased dramatically after adding the NTR1 antagonist SR48692, which implied that NTS-induced IL-8 caused the M2 polarization of CD68+ macrophages in THP-1 cells. b. THP-1 cells were cultured in IL-8-supplemented medium, leading to a significant increase of the percentages of CD68+ cells and CD163+CD206+ cells, but a decrease of the percentage of CCR7+ cells. c. The levels of IL-10 in the supernatants were significantly higher in IL-8-treated THP-1 cells, but the levels of IL-12 were decreased. No difference in the levels of TGF-β was detected. d. Exogenous IL-8 did not affect the proliferation of THP-1 cells. e. Exogenous IL-8 did not affect the apoptosis of THP-1 cells. f. IL-8 enhanced cell migration through the BME membrane. g. IL-8 enhanced the phagocytosis ability of THP-1 cells against exogenous fluorescence-labeled A549 cells.
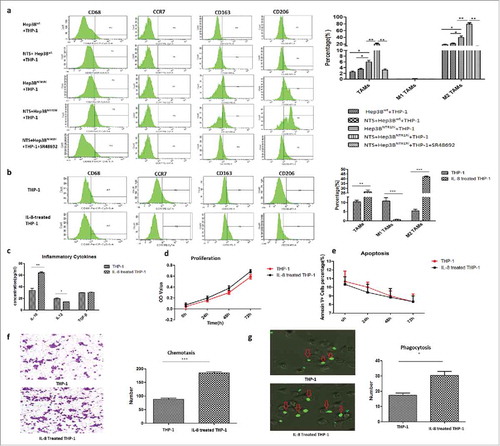
Figure 7. IL-8-activated TAMs promoted tumor invasion by accelerating EMT of HCC cells in a non-membrane-bound manner. a. The wound-closure rate at 24 h or 48 h of the Hep3B+TAM group was higher than that of the Hep3B+THP-1 or Hep3B group. b. The effect of TAMs on the migration of HepG2 cells was in correspondence with the result of Hep3B cells. c. The numbers of invasive Hep3B cells in the Hep3B+TAM group increased compared to the other groups. d. The effect of TAMs on the invasion function of HepG2 cells was in correspondence with that of Hep3B cells. E. The mRNA and protein expression levels of N-cadherin and β-catenin increased, and those of E-cadherin decreased in the Hep3B+TAM group compared to the other groups. The protein levels of the transcription factors Snail and Slug increased in the Hep3B+TAM group. f. The mRNA and protein expression levels of N-cadherin, β-catenin, Snail, and Slug increased, whereas that of E-cadherin decreased in the HepG2+TAM group compared to the other groups. g. Hep3Bwt cells were co-cultured with THP-1 cells in Transwell plates to avoid direct cell-cell contact. Similar tendency of the EMT markers was detected as co-culture system. h. Same result was obtained in HepG2wt cells, which IL-8-activated TAMs promoted tumor invasion by accelerating EMT of HCC cells in non-membrane-bound manner.
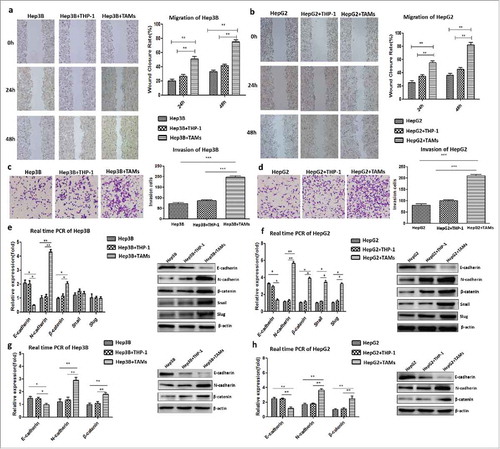
Figure 8. Blocking the NTS/IL-8 signaling pathway inhibited HCC development and metastasis in vivo. a. The tumor size substantially shrunk in reparixin group compared to control group, but no significant difference was found in SR48692 group compared to the controls. b. The tumor size shrunk in reparixin group and SR48692+reparixin group compared to the controls. No significant difference was observed between reparixin group and SR48692+reparixin group. c. The numbers of lung metastatic nodules decreased after SR48692, reparixin or combination treatment. And the number of metastasis nodules in SR48692+reparixin group was lower than that in reparixin group d. EMT markers were analyzed among three groups, and significantly reduced expression levels of N-cadherin and β-catenin proteins was found in primary tumor tissues after SR48692, reparixin or combination treatment.
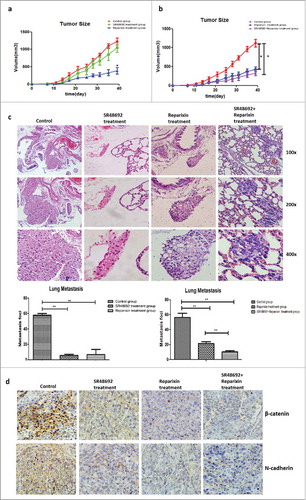
Table 1. The basic clinical-pathological information of 100 HCC patients.
Table 2. The correlation between NTS/IL-8 co-expression and multiple clinical-pathological features of HCC patients at both mRNA and protein levels.
Table 3. The RT-PCR primers of interested genes.